


Lakes Environmental e-Newsletter
In this issue:
- News & Events
- Upcoming Courses
- Modeling Tip: New Percentile Utility in CALPUFF View
- Articles
- Upcoming Conferences & Trade Shows
News & Events
CALPUFF View� Version 7.5 Released!
On May 1, 2015 Lakes Environmental released CALPUFF View Version 7.5. New features included in this release are:
|
For a detailed listing of updates available in CALPUFF View Version 7.5, please check out our latest release notes.
If you are currently in maintenance for CALPUFF View and did not receive an email regarding this update, please contact us at support@webLakes.com.
If you are a user of CALPUFF View but are no longer in maintenance, please contact LakesSoftware@webLakes.com for pricing to get up and running on version 7.5.
AERMOD and CALPUFF Courses in Edmonton, Alberta � A Few Spots Still Available!
|
A few spots remain available for the AERMOD and CALPUFF training in Edmonton from June 1 to 4, 2015. Course: AERMOD (June 1-2, 2015) |
Lakes Environmental at A&WMA Conference and Exhibition
|
Lakes Environmental will be in Raleigh, North Carolina, from June 22-25, 2015 for the 108th Annual Air & Waste Management Conference and Exhibition. Drop by booth #506 to meet our friendly, knowledgeable staff and for your chance to win a FREE copy of our AERMOD View or AERSCREEN View air dispersion modeling software! Visit the conference website to register for this annual event. This year's conference offers excellent opportunities for the environmental professional. You don�t want to miss it! |
Lakes Environmental Teaching Professional Development Courses at 2015 A&WMA Conference and Exhibition
As in previous years, the Air & Waste Management Association will be offering a variety of high quality professional development courses prior to the annual conference in Raleigh. This year, Lakes Environmental President, Dr. Jesse Th�, will be teaching a one-day introductory course on AERMOD air dispersion modeling. Please find below a listing of these courses.
AIR-299: AERMOD Air Dispersion Modeling � Sunday, June 21
Don�t miss this opportunity to be a part of these exciting and cost effective courses!
Congratulations to our AERMOD View Winner!
The winner of our AERMOD View draw at the Canadian Environmental Conference & Tradeshow (CANECT 2015) is Ravi Sharma from ETCOS.Environmental.
Congratulations Ravi!
Upcoming Courses

Date |
Course |
Location |
Registration |
Jun 1-2, 2015 |
|||
Oct 19-20, 2015 |
Registration |
||
Nov 9-10, 2015 |
Registration |
||
Sep 21-22, 2015 |
Toronto, ON |
Registration |
|
Oct 15-16, 2015 |
Chicago, IL |
Registration |
For more information on the above courses, including registration information, location, and course outlines, please visit our web site: https://www.weblakes.com/courses.html.
Modeling Tip
New Percentile Utility in CALPUFF View
The CALPUFF modeling system is used extensively for air dispersion modeling studies, but there is at least one drawback to the system. CALPUFF and its associated pre- and post-processors do not feature dynamic memory allocation. This means there are finite limits to many input parameters of the modeling system. These limits can impact the modeler�s ability to easily run the models. One example can be found when using the CALPOST model for post-processing CALPUFF model results.
Percentiles & Ranked Values
CALPOST is used to extract top-ranked concentrations for comparison to ambient air quality standards. In the United States, the standards are generally based on ranked values (e.g., 1st highest, 2nd highest, etc.). Other countries, however, have percentile-based standards (e.g., 99.8th, 99th, 90th, etc.). Since CALPOST does not natively support percentiles, the modeler must first calculate an equivalent rank.
For example, say a modeler is asked to find the 98th percentile of a 24-hour average over 1 year of modeled data.
- 1 year of modeled data = 365 days
- 24-hour average = 1 output value per receptor per day
- 98% of 365 = 7.3 (1.0 - 0.98 = 0.02 * 365 = 7.3)
- Since ranked values must be an integer, 7.3 is rounded up to 8
Thus, the 98th percentile of a 24-hour average becomes the 8th high ranked value when using CALPOST. What if the modeler wants the 98th percentile for a 1-hour average?
- 1 year of modeled data = 8,760 hours
- 1-hour average = 1 output value per receptor per hour
- 98% of 8,760 = 175.2 (1.0 - 0.98 = 0.02 * 8760 = 175.2)
- Since ranked values must be an integer, 175.2 is rounded up 176
Unfortunately, the native CALPOST model cannot accept a maximum rank greater than 10 (MXRNK <=10). Modelers could recompile CALPOST to accept a higher rank, but this requires a working knowledge of FORTRAN and model compilation that many modelers do not have. To solve this problem, Lakes Environmental developed a utility for handling percentiles directly in the CALPUFF modeling system.
New Percentile Utility from Lakes Environmental
CALPUFF View Version 7.5 was released on May 1, 2015. This update includes a brand-new utility for calculating percentiles. This utility bypasses CALPOST entirely and analyzes the hourly data in the direct CALPUFF concentration and deposition flux output files (e.g., CONC.DAT, DFLX.DAT, etc.). The output is a set of contour plot files visualized in CALPUFF View.
The Percentiles utility is found in CALPUFF View�s CALPOST Wizard. Follow the steps below to use the utility.
Step 1: Open the CALPOST Wizard and navigate to the Percentiles tab.
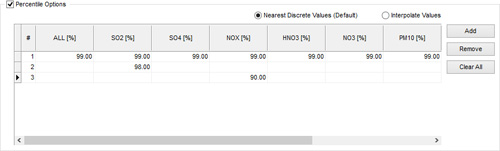
Step 2: Enable the Percentile Options checkbox to turn on the utility.
Step 3: hoose whether you want to output the nearest ranked value to the specified percentile (Nearest Discrete Values) or if you want the model to interpolate between ranked values (Interpolate Values). For example, the 98th percentile 1-hour average described above would extract the 176th ranked value if Nearest Discrete Values is enabled. The Interpolate Values option would interpolate concentrations between the 175th and 176th ranked values.
Step 4: Click the Add button to add a new percentile to the table
Step 5: Enter the desired percentile value. Use the ALL column to specify the same percentile value for every modeled species. For species-specific percentiles, input a value in the desired species� column. The example below would produce 99th percentile output for all species, 98th percentile output for SO2 only, and 90th percentile output for NOX only
Step 6: Choose what Output Type you want to apply the percentiles to: Concentration, Dry Deposition, Wet Deposition, and/or Total Deposition.
Step 7: Select the Averaging Period(s) of interest. If any periods are unavailable, go to the CALPOST Wizard�s Averaging Period tab to enable other desired periods.
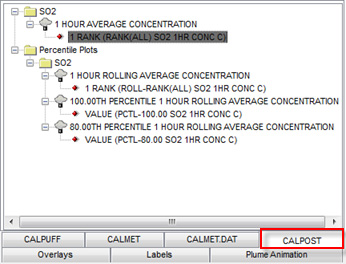
Step 8: Once you have specified your settings, click the ![]() button to generate the percentile plot files. These files are available under the Percentile Plots folder displayed in the CALPOST tab as seen in image below. To view the text file for the percentile results, double-click on the percentile/rolling average plot file title.
button to generate the percentile plot files. These files are available under the Percentile Plots folder displayed in the CALPOST tab as seen in image below. To view the text file for the percentile results, double-click on the percentile/rolling average plot file title.
Submit Your Modeling Tips Today!
We are currently accepting submissions for the Monthly Modeling Tip section that appears in our newsletters. If you have a modeling tip that may benefit our readers, please send it to us at support@webLakes.com. Your name and the name of your organization will appear below the tip providing you with an opportunity for increased exposure.
Articles
Ozone Pollution in Europe: Fewer Alert Days but Concentrations Still High
May 6, 2015 - Air pollution by ground-level ozone continued to affect many countries across Europe during summer 2014, according to a new briefing published by the European Environment Agency (EEA). Almost all reporting countries exceeded at least once the long-term objective set by EU legislation, while the stricter alert threshold was exceeded only on four occasions.
Exposure to high concentrations of ground-level ozone can cause and aggravate cardiovascular and respiratory diseases. The European Union's Air Quality Directive sets four standards to reduce air pollution by ozone and its impacts on health.
Supreme Court Orders Government Action on UK Air Quality
April 29, 2015 - The UK�s highest court has sent a shiver through the diesel car industry by ordering the government to show it is serious about tackling the air pollution that blights London and other cities.
In a unanimous judgment, the Supreme Court said the government must speed up efforts to meet European pollution standards and submit new air quality plans to Brussels no later than December 31, regardless of the May 7 general election outcome.
Ontario Releases 2013 Air Quality in Ontario Report
April 15, 2015 - On the one year anniversary of the last coal plant closure in Ontario, the release of the 2013 Air Quality in Ontario report confirms that the province's air quality has improved significantly over the past 10 years as levels of pollutants and greenhouse gas pollution continue to decrease.
EPA Publishes 20th Annual U.S. Greenhouse Gas Inventory
April 14, 2015 - WASHINGTON - The U.S. Environmental Protection Agency (EPA) released its 20th Inventory of U.S. Greenhouse Gas Emissions and Sinks today, showing a two percent increase in greenhouse gas emissions in 2013 from 2012 levels, but a nine percent drop in emissions since 2005.
Total U.S. greenhouse emissions were 6,673 million metric tons of carbon dioxide equivalent in 2013. By sector, power plants were the largest source of emissions, accounting for 31 percent of total U.S. greenhouse gas pollution. The transportation sector was the second largest source, at 27 percent. Industry and manufacturing were the third largest source, at 21 percent. The increase in total national greenhouse gas emissions between 2012 and 2013 was due to increased energy consumption across all sectors in the U.S. economy and greater use of coal for electricity generation.
Canadian Physicians Group Blames Coal Power for Edmonton's Poor Air Quality
April 14, 2015 - A group of physicians is cautioning that Edmonton's air quality is worse than that of other larger centres such as Toronto, a fact they blame in part on coal-fired electrical generating plants.
The Canadian Association of Physicians for the Environment has examined a decade's worth of air quality data, which group member Dr. Joe Vipond says show a troubling trend in Edmonton.
Although only about one-fifth the size of greater Toronto in terms of population, Edmonton has significantly higher levels of fine particulate matter in the air, the group's findings suggest.
Upcoming Conferences & Trade Shows
Date |
Conference |
Location |
May 26-28, 2015 |
Carbon Expo 2015 |
Barcelona, Spain |
Jun 1-3, 2015 |
23rd International Conference on Modelling, Monitoring and Management of Air Pollution |
Val�ncia, Spain |
Jun 15-19, 2015 |
Asia Clean Energy Forum |
Manila, Philippines |
Jun 22-25, 2015 |
A&WMA 108th Annual Conference & Exhibition |
Raleigh, NC, USA |
Jun 23-24, 2015 |
Emissions 2015 |
Troy, MI, USA |
Jul 15-17, 2015 |
5th International Conference on Environmental Pollution and Remediation (ICEPR 2015) |
Barcelona, Spain |
Jul 22-24, 2015 |
6th International Congress of Energy and Environment Engineering and Management (CIIEM15) |
Paris, France |
Sep 3-5, 2015 |
14th International Conference on Environmental Science and Technology |
Rhodes, Greece |
Nov 1-5, 2015 |
SETAC North America 36th Annual Meeting |
Salt Lake City, UT, USA |
Nov 17-18, 2015 |
International Petroleum Environmental Conference (IPEC) |
Denver, CO, USA |
Nov 18-19, 2015 |
Petroleum, Refining & Environmental Monitoring Technologies (PEFTEC) 2015 |
Antwerp, Belgium |
About this Newsletter
This newsletter contains information gleaned from various sources on the web, with complete links to the sources cited. Organizations cited are in no way affiliated with Lakes Environmental Software.
Lakes Environmental Software is a leading environmental IT company that offers a complete line of air dispersion modeling, risk assessment, emissions inventory, and emergency release software as well as training and custom software services. With satisfied users located around the globe, Lakes Environmental Software will continue to revolutionize the environmental software field.
For more information please visit our web site at: www.webLakes.com. You may also contact us by phone at (519) 746-5995 or by fax at (519)746-0793.
All comments and suggestions are welcome. You can e-mail us at: support@webLakes.com.