|
We previously discussed a fundamental limitation of the CALPUFF modeling system which places finite limits on how many objects and calculations the various system executables can handle in a single project. One area where modelers can experience this limitation is in defining output values in the CALPOST model for post-processing CALPUFF model results.
CALPOST is used to extract top-ranked concentrations for comparison to ambient air quality standards. In the United States, the standards are generally based on ranked values (e.g., 1st highest, 2nd highest, etc.). Other countries, however, have percentile-based standards (e.g., 99.8th, 99th, 90th, etc.). Since CALPOST does not natively support percentiles, the modeler must first calculate an equivalent high. For example, if a modeler is asked to find the 98th percentile of a 24-hour average over 1 year of modeled data.
- 1 year of modeled data = 365 days
- 24-hour average = 1 output value per receptor per day
- 98% of 365 = 7.3
- Since ranked values must be an integer, 7.3 is rounded up to 8
Thus, the 98th percentile of a 24-hour average over one year becomes the 8th highest ranked value when using CALPOST. What if the modeler wants the 98th percentile for a 1-hour average?
- 1 year of modeled data = 8,760 hours
- 1-hour average = 1 output value per receptor per day
- 98% of 8,760 = 175.2
- Since ranked values must be an integer, 175.2 is rounded up 176
Unfortunately, the native CALPOST model cannot accept a maximum rank greater than 10. Modelers could recompile CALPOST to accept a high rank, but this requires a working knowledge of FORTRAN and code compilation practices. To solve this problem, Lakes Environmental developed a utility for handling percentiles directly in the CALPUFF modeling system: the Percentiles utility found in CALPUFF View’s CALPOST Wizard.
This utility bypasses CALPOST entirely and analyzes the hourly data in the direct CALPUFF concentration and deposition flux output files (e.g., CONC.DAT, DFLX.DAT, etc.). After calculating the user-defined percentiles, a set of contour plot files is built for visualization in CALPUFF View. Follow the steps below to use this utility.
Step 1: Open the CALPOST Wizard and navigate to the Percentiles tab.
Step 2: Enable the  checkbox to turn on the utility. checkbox to turn on the utility.
Step 3: Choose whether you want to output the nearest ranked value to the specified percentile (Nearest Discrete Values) or if you want the model to interpolate between ranked values (Interpolate Values). For example, the 98th percentile 1-hour average described above would extract the 176th ranked value if Nearest Discrete Values is enabled. The Interpolate Values setting would interpolate concentrations between the 175th and 176th ranked values.
Step 4: Click  the button to add a new percentile. the button to add a new percentile.
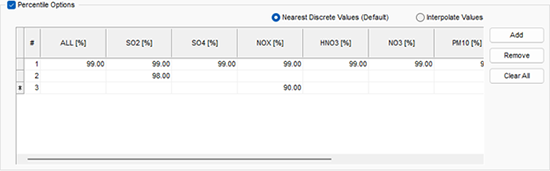
Step 5: Enter your percentiles. Use the ALL column to specify the same percentile value for every modeled species. For species-specific percentiles, input a value in the desired species’ column. The example below would produce 99th percentile output for all species, 98th percentile output for SO2 only, and 90th percentile output for NOX.
Step 6: Choose what Output Type you want to apply the percentiles to: Concentration, Dry Deposition, Wet Deposition, and/or Total (Dry+Wet) Deposition.
Step 7: Select the Averaging Period(s) of interest. If any periods are unavailable, go to the CALPOST Wizard’s Averaging Period tab to enable other desired periods.
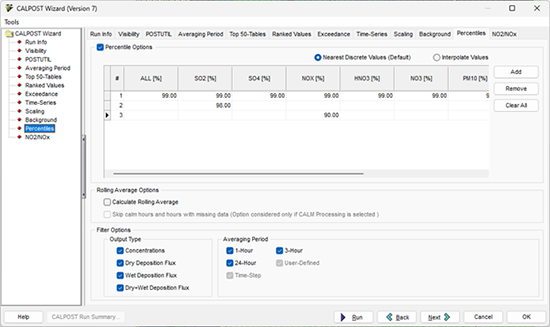
Step 8: Once you have specified your settings, click the  button to generate the percentile plot files. These files are available under the Percentile Plots folder displayed in the CALPOST tab of the Tree View. button to generate the percentile plot files. These files are available under the Percentile Plots folder displayed in the CALPOST tab of the Tree View.
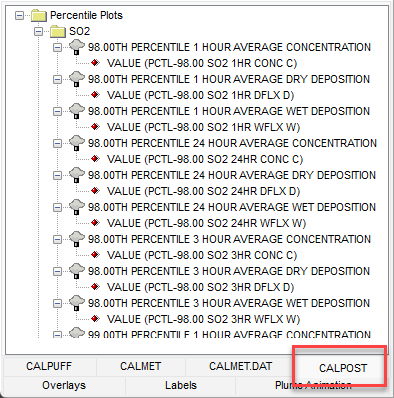
To view the text file of results, double-click on the percentile/rolling average plot file title next to the  icon. icon.
|