Compliance Corner: Navigating the Regulatory Realm |
|
Are Reporting Violations Leading to Costly Penalties?
Agencies including the San Joaquin Valley Air Pollution Control District (CA), Louisville Metro Air Pollution Control District (KY), Texas Commission on Environmental Quality (TCEQ), Oregon Department of Environmental Quality (DEQ), and Washington's Southwest Clean Air Agency have issued enforcement actions and monetary penalties for failing to submit accurate and timely annual emissions inventory reports.
The foundation for these reporting requirements is EPA's Air Emissions Reporting Requirements (AERR) rule (40 CFR Part 51, Subpart A), which requires state and local air agencies to inventory emissions sources, including stationery and mobile sources. Currently, EPA requires reporting of criteria air pollutants and their precursors, including volatile organic compounds (VOCs) and ammonia. While hazardous air pollutants (HAPs) are not yet federally required under the AERR, many state and local agencies already collect and report HAP emissions data voluntarily.
These federal requirements flow down to state and local air agencies, which in turn require regulated facilities to calculate, maintain, and report emissions inventory data. As enforcement activity continues to increase, organizations must ensure that their emissions inventory data are accurate, complete, and submitted on time.
In 2023, EPA proposed significant amendments to the AERR that would require mandatory reporting of hazardous air pollutants and direct reporting of emissions data by major sources to EPA. Although the proposed rule has not been finalized, it signals EPA's continued focus on improving emissions data quality and reporting transparency.
AQMIS simplifies emissions inventory management by providing a comprehensive platform for emissions calculations, recordkeeping, reporting, and compliance tracking. Whether you manage a single facility or a multi-site operation, AQMIS can help reduce reporting risk, improve data accuracy, and streamline your compliance workflow.
Contact us today to learn how AQMIS ccan help your organization confidently meet its air emissions reporting obligation!
|
|
|
Online AERMOD Course � July 14-15, 2026 - Only a Few Spots Left! |
 |
Register today for our next available 2-day online AERMOD course taking place on July 14 and 15, 2026 from 8:30am to 5:00pm (Central Time � Chicago, USA).
Register today before space is gone!
Note: Due to the immense popularity of our online courses and small class sizes, we recommend registering and making payment as soon as possible to reserve your spot.
|
|
Online CALPUFF Course � September 29-30, 2026 |
 |
Enhance your air dispersion modeling skills by registering for our 2-day online CALPUFF course taking place on September 29 and 30, 2026 from 8:30am to 5:00pm (Central Time � Chicago).
Led by our expert instructors, this course offers in-depth instruction and hands-on exercises designed to help you effectively apply the CALPUFF modeling system in real-world scenarios.
Registration is now open � secure your spot today!
|
|
Just Announced � New Online AERMOD Courses! |
 |
We�re pleased to announce the following upcoming Online AERMOD Air Dispersion Modeling Courses. Join us for world-class training from our senior level air quality experts!
Online registration is available now. Our online courses sell out quickly! We recommend registering and making payment as soon as possible.
Don�t miss out, sign up today!
|
|
Lakes Environmental Closed for Canada Day Holiday |
Lakes Environmental will be closed on Wednesday, July 1, 2026 to observe the Canada Day holiday. Our Dallas office will remain open on this day. If you have any needs during that time, please e-mail us at support@webLakes.com and we will respond to your inquiry as soon as possible.
|
|
UPCOMING TRAINING COURSES |
|

|
MODELING TIP |
CALPUFF View�s Wind Rose Tool |
|
The CALPUFF air dispersion model relies on three-dimensional gridded meteorological fields to simulate the transport, dispersion, and deposition of pollutants. These meteorological fields may be generated by the CALMET meteorological preprocessor or derived directly from prognostic meteorological models.
Understanding these meteorological inputs is often just as important as interpreting the resulting concentration predictions. CALPUFF View includes a tool that allows users to generate wind roses providing a simple way to examine wind patterns anywhere within the modeling domain. The tool can also extract other meteorological variables such as temperature and mixing height for further analysis.
Follow these steps to create a custom wind rose with CALPUFF View:
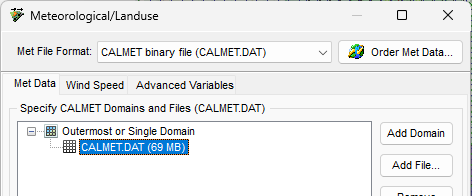
Step 1: Insert a CALMET.DAT file to your CALPUFF View project. If you run CALMET in the application, the file will automatically load into your CALPUFF setup. For CALMET.DAT files generated outside CALPUFF View, go to the Meteorological/Landuse settings of the CALPUFF Wizard and click the Add File button.
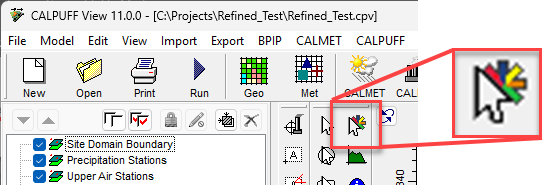
Step 2: Select the Wind Rose Tool on the Annotation Toolbar.
Step 3: Click the left mouse button on the drawing area, at the location where you want to generate a wind rose. The Wind Rose Tool dialog is displayed.
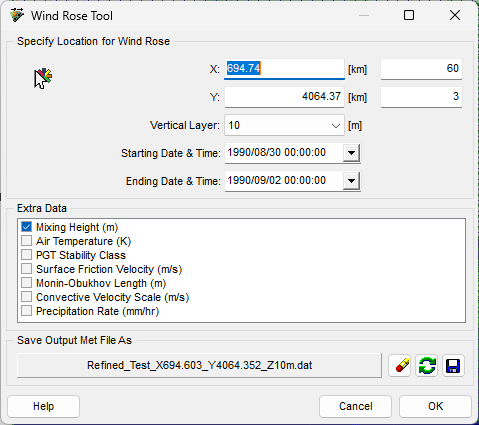
The X and Y coordinates and grid cell numbers of the selected location are displayed in the Specify Location for Wind Rose panel. You can change these values at any time if you desire. You can also modify the vertical layer, start time, and end time to be extracted.
Step 4: Under Extra Data, select any additional meteorological parameters you would like to extract from the CALMET.DAT file. Although these parameters are not displayed on the wind rose, they are written to the output time-series file (*.dat) in ASCII text format from which they can be read and analyzed.
Step 5: The Save Output Met File As panel displays a default file name and location for the generated data file. You can modify the default file or save location as desired. The output file contains time-series data extracted from the selected grid cell and vertical layer within the CALMET.DAT file.
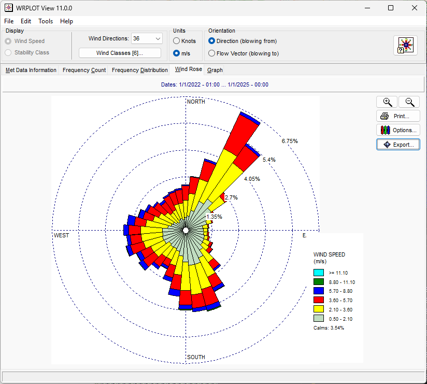
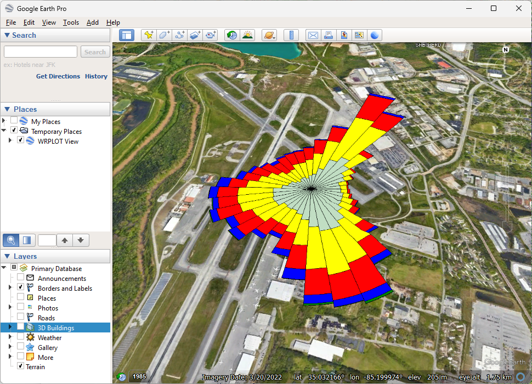
Step 6: Once generated, the output data file is automatically displayed as a wind rose in WRPLOT View. In addition to the graphical wind rose, WRPLOT View provides tabular frequency distributions, wind distribution charts, and the ability to export the wind rose to Google Earth.
|
|

|
ENVIRONMENTAL NEWS ARTICLES |
Rising Seas Could �Drown� Mangroves and Release Carbon |
June 3, 2026 - Mangroves are made up of salt-tolerant plants that grow in coastal areas. They cover less than 1% of Earth�s surface but store about 15% of all ocean carbon, most of it in their soils.
Read more → |
|
Tire Pollution May Threaten Human Health, Study Finds |
June 2, 2026 - Tiny particles of rubber cast off by car tires, which have long been known to harm wildlife, may also pose a risk to humans, according to a new study.
Read more → |
|
|
|
LAKES SOFTWARE GROUP OF COMPANIES
|
 |
445 Wes Graham Way, Unit 203,
Waterloo, ON N2L 6R2
View Online
This newsletter contains information gleaned from various sources on the web, with complete links
to the sources cited. Organizations cited are in no way affiliated with Lakes Environmental Software.
For more information, please visit our web site at: www.webLakes.com.
All comments and suggestions are welcome. You can e-mail us at: support@webLakes.com.
Privacy Policy |
|
| | |