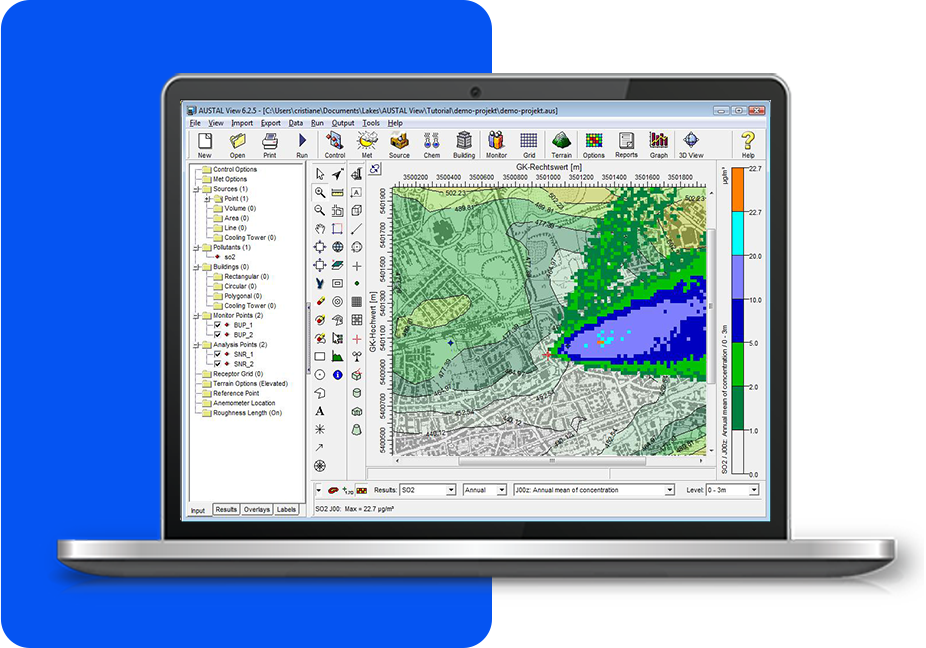
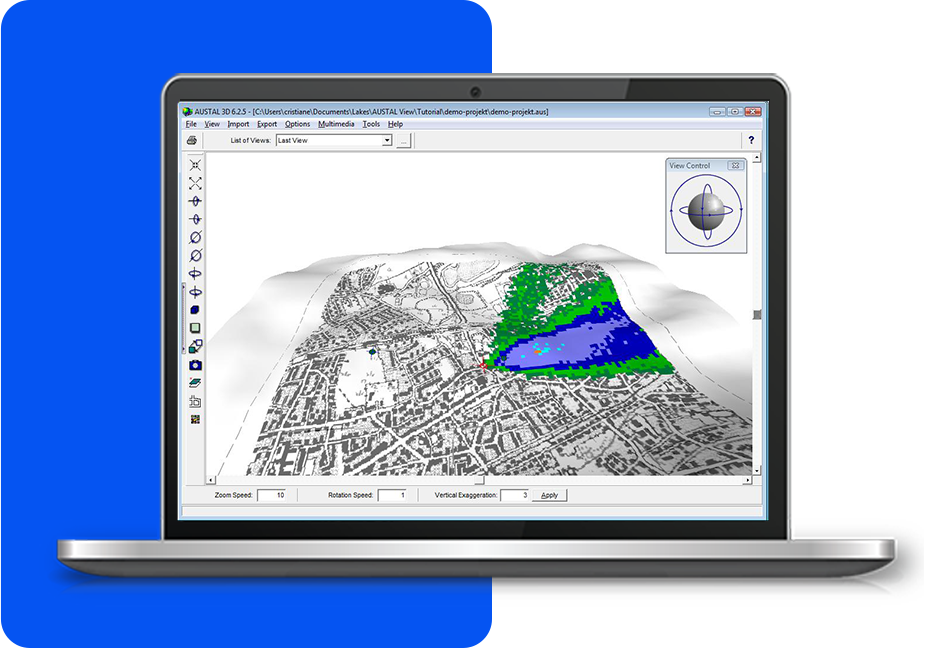
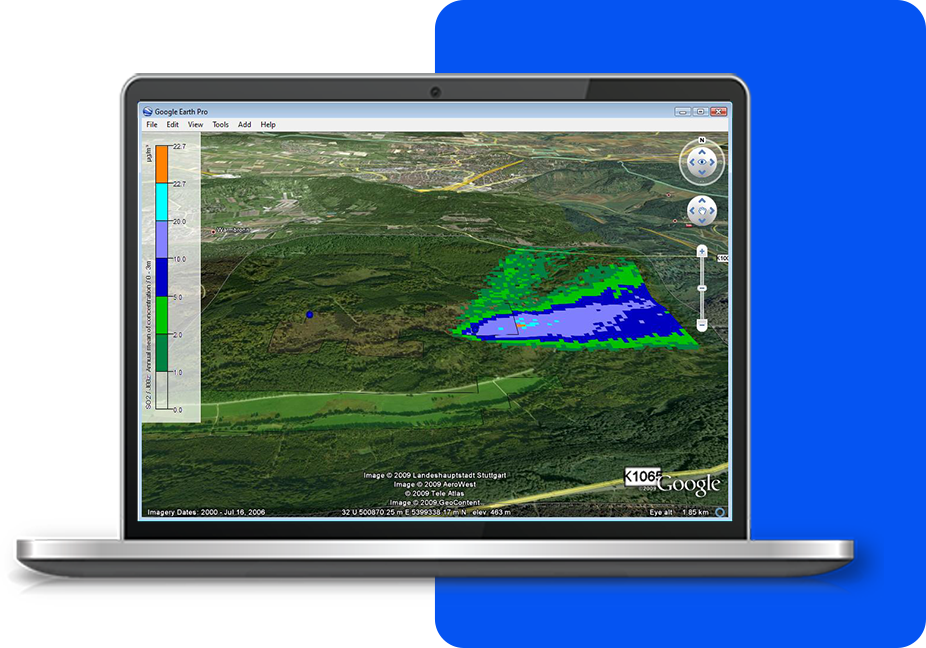
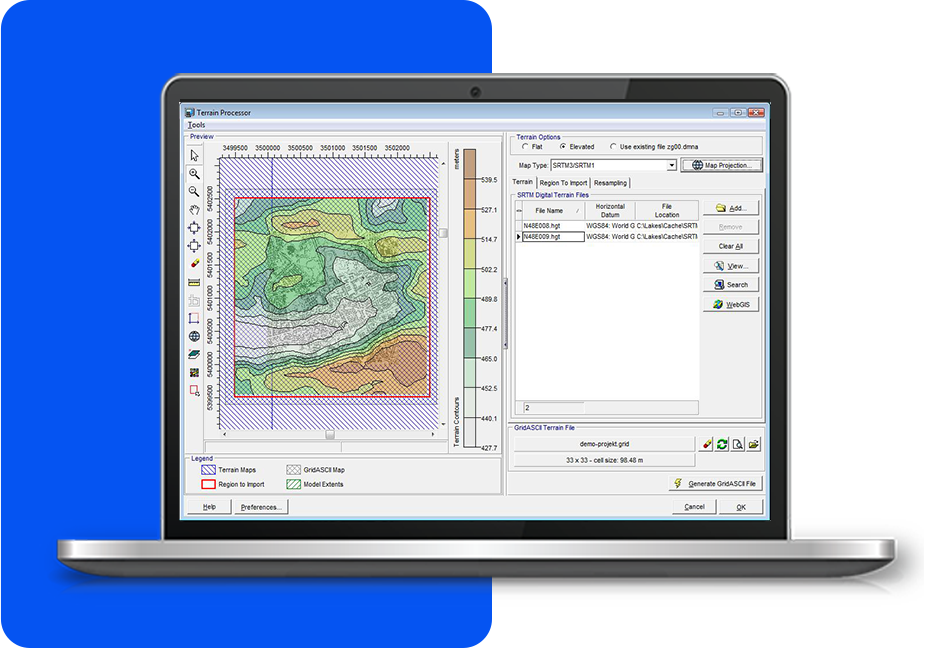
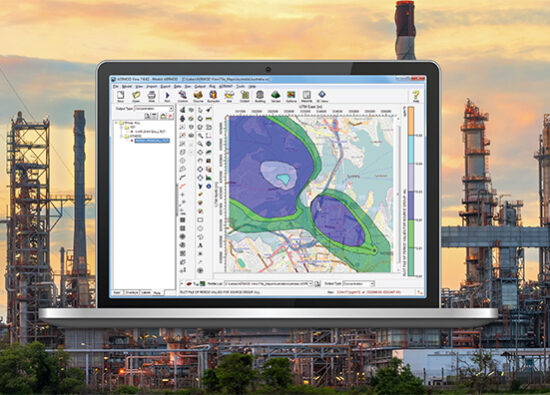
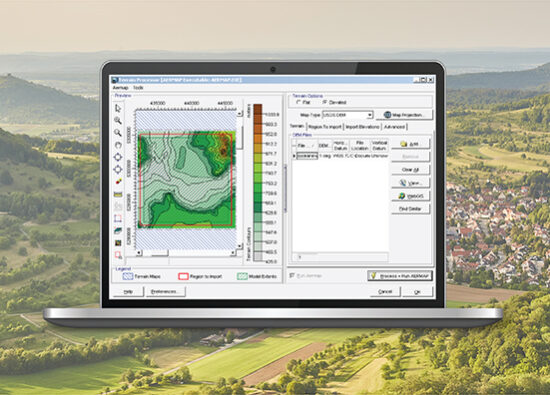
Features

Lagrangian Particle Tracking Air Dispersion Model

KEY FEATURES


INTEGRATED GRAPHICAL USER INTERFACE

Fully integrated interface combining easy to use graphical tools (e.g., sources, buildings, monitor points, and grid), seamless model run, and automated contouring and posting of results.


POWERFUL 3D VISUALIZATION

Complete 3D visualization of your entire modeling area. Sources, buildings, and modeling results are displayed in context with the surrounding terrain. Apply custom textures to buildings to further increase building realism. Create animation file (*.avi) of your 3D visualization.


EXPORT TO GOOGLE EARTH

This exciting feature allows you to export your buildings, sources, receptors and contours into Google Earth giving you a more realistic image of where your pollutants will impact surrounding areas.


AUTOMATED DOWNLOAD OF TERRAIN DATA (SRTM)

Advanced terrain processing capabilities available for several terrain data formats such as SRTM, USGS DEM, and XYZ.. Automated download of DEM and SRTM files from webGIS. SRTM3 data at 90m resolution is available worldwide. Automated conversion of these formats into the GridASCII data format required by the model.


SUPPORT FOR SEVERAL BASE MAP FORMATS

Visualizing your site in AUSTAL View is easy. Our full-featured support for a variety of image and base map formats allow you to design your model with confidence and view your results in context with your site. Supported base maps include: Bitmap, DLG, DXF, JPEG, LULC, MrSID, Shapefile, and TIFF/GeoTIFF.

ADDITIONAL FEATURES


There is more to AUSTAL View than great looks. Each copy contains everything you'll need to complete your project without paying for costly add-ons.

Professional Reports

Clear communication of your modeling and results are crucial to a successful project. AUSTAL View lets you impress with integrated report generation. "Source Parameters", "Monitor Point Results", and "Maximum Calculation Results" are examples of reports automatically generated by AUSTAL View.

Met Data Visualization Tool - Windrose

Meteo View allows you to create windrose plots for your meteorological data. The following formats are supported: AKT, AKTerm, AKS, series.dmna, zeitreihe.dmna. Options to manipulate the appearance of the windrose are available such as colors, petal size, grid sectors, etc.


Met Data Visualization Tool - Graph

Meteo View, which is included with the package, can also display bar graphs of the wind class and dispersion class frequency distribution and time series graph for wind speed, wind direction, and dispersion class.

German and English Versions Available

The AUSTAL View user interface, help files, and user's guides are available in German and English languages. The AUSTAL model is also available in both languages.