
445 Wes Graham Way, Unit 203

Modeling Tips

  • July 23, 2026

New WebGIS Data: NASADEM

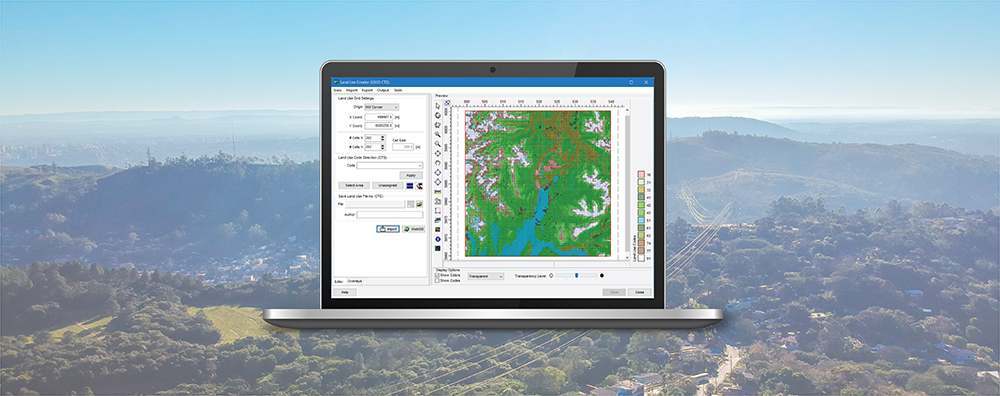
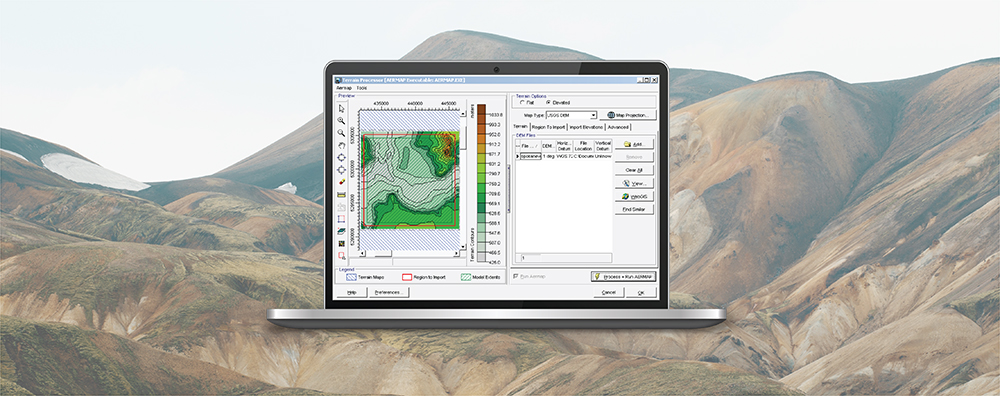
WebGIS provides access to global geophysical data for air dispersion modeling, risk assessment, and other technical applications. Lakes Software’s commercial products – such as AERMOD View, CALPUFF View, and more – integrate WebGIS to automatically download terrain and land use data directly into projects.

  • June 22, 2026

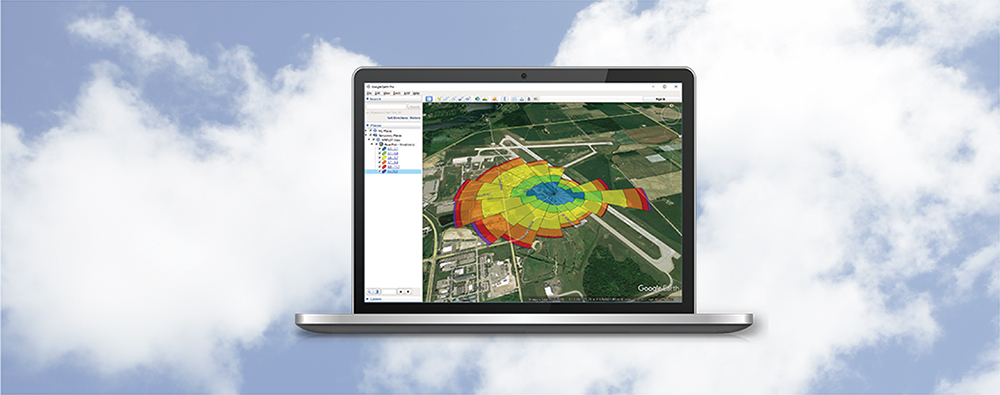
CALPUFF View: Wind Rose Tool

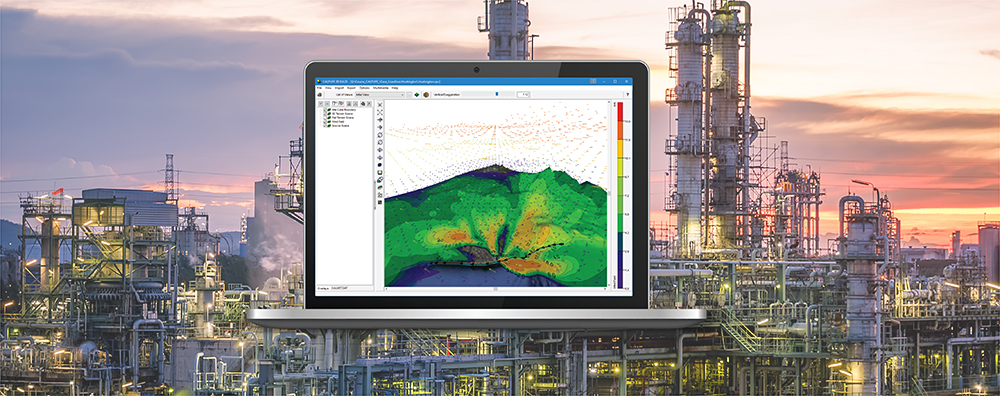
The CALPUFF air dispersion model relies on three-dimensional gridded meteorological fields to simulate the transport, dispersion, and deposition of pollutants.

  • May 27, 2026

Lakes Software Products: Working with Overlays

One of the cornerstones to working with Lakes Environmental Software products is the drawing area. This is where all objects and layers are displayed for viewing and editing. One tool users have to properly control what is displayed in the drawing area is the Overlays tab on the Tree View.

  • April 23, 2026

AERMOD View: Choosing Pollutants

AERMOD, one of the most widely-used air dispersion models in the world for analyzing ambient air pollutant concentrations, is typically applied for a wide variety of buoyant and neutrally-buoyant releases. One recurring question about the model is what pollutants it can (or cannot) model. Coded into the model is a list of pollutant types used to identify the pollutant being modeled for a particular run.

  • March 30, 2026

CALRoads View: Modeling Inert Gases

CALRoads View is an air dispersion modeling package used to predict air quality impacts near roadways from both moving and idling vehicles. Three dispersion models are integrated into the application: CALINE4, CAL3QHC, & CAL3QHCR. The original design of these models accounted only for releases of particulate matter (PM), carbon monoxide (CO), or nitrogen dioxide (NO2) with no further support for other inert gases.

  • February 24, 2026

AERMOD View: When Numerical Values Are Outside AERMOD’s Default Threshold

A standard model run using the AERMOD air dispersion model produces numeric output with up to 13 significant figures (e.g., xxxxxxxx.xxxxx). Projects which use very low or very high emission rates may run into a problem where the values output by the model do not fit properly within this limit. For example, concentration values of 1E9 units or higher will result in a field of asterisks written to the output file as shown below.