EMISSIONS MANAGEMENT
AQMIS Dashboards and Key Features
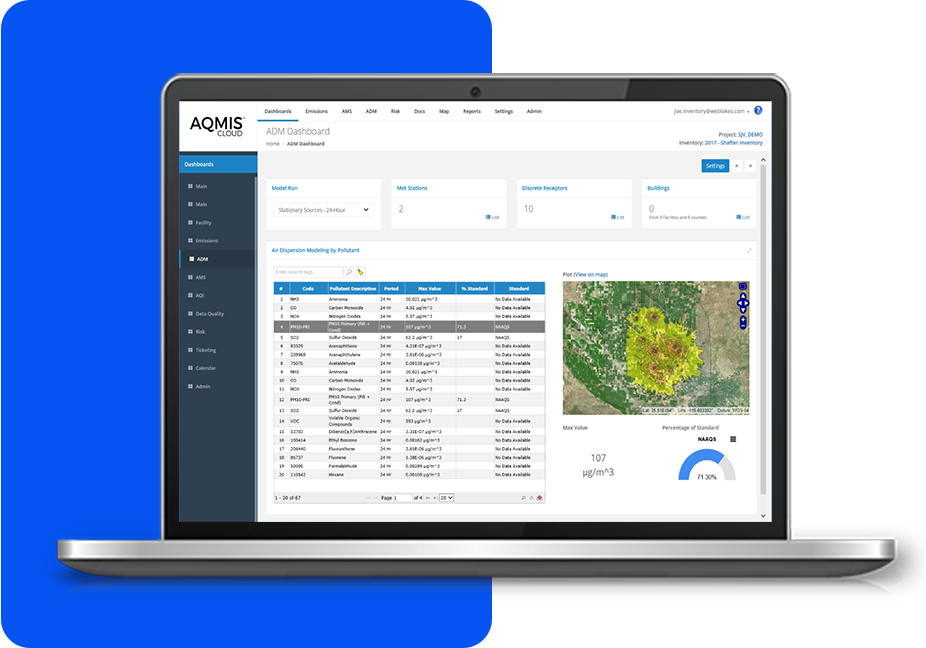
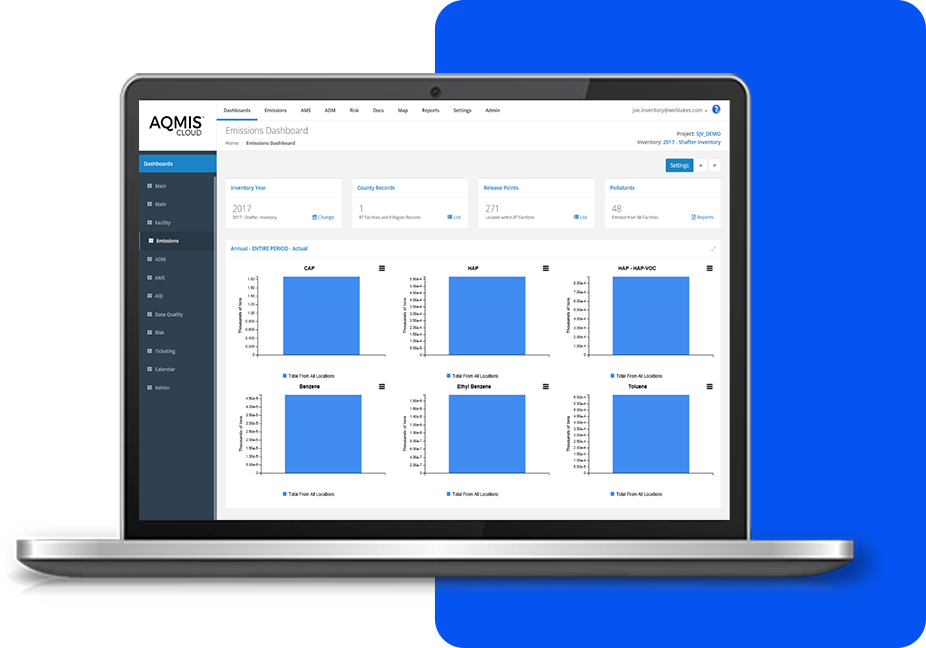
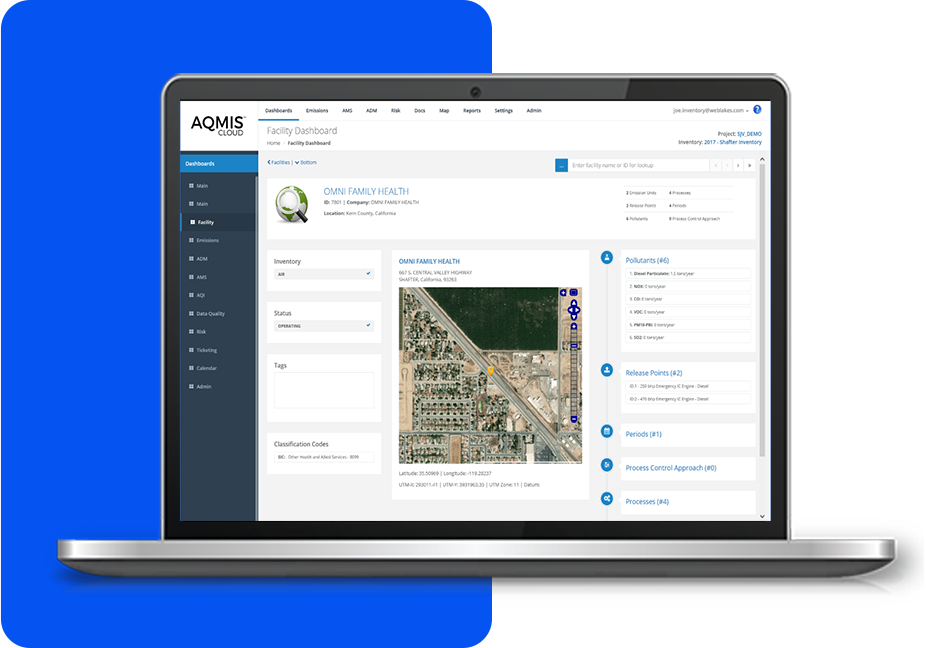
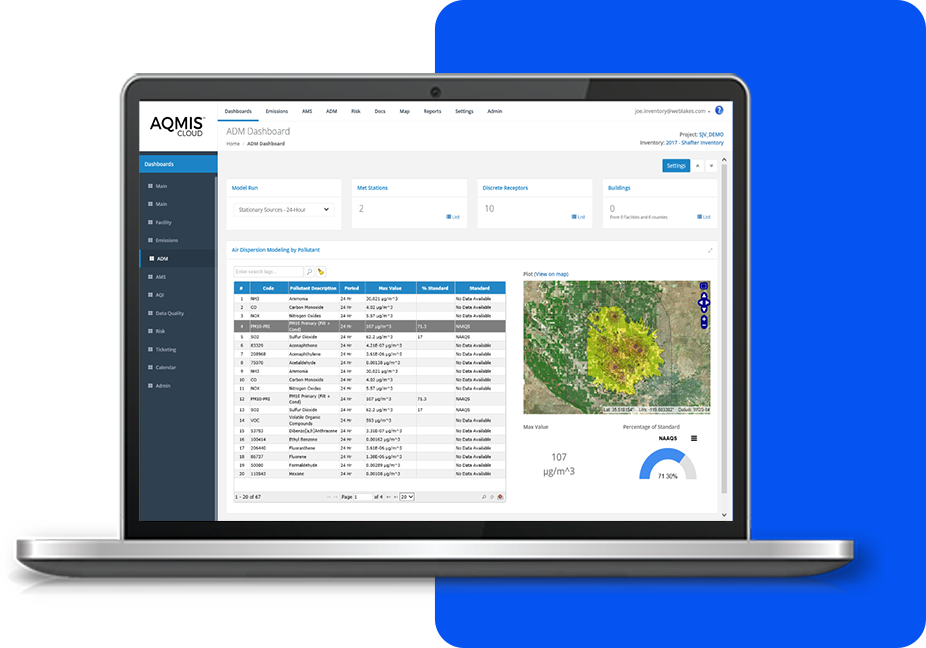
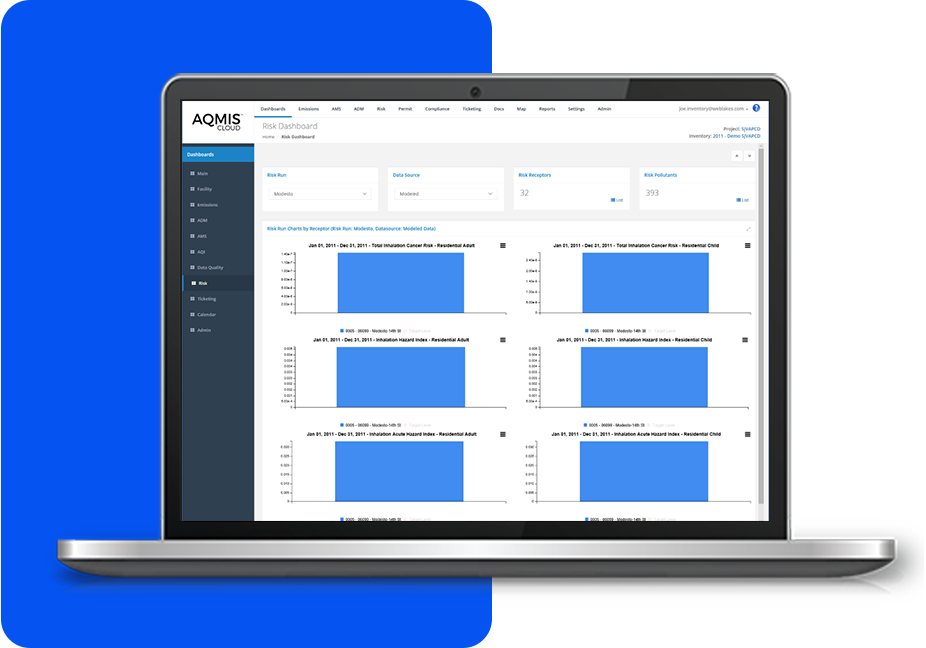
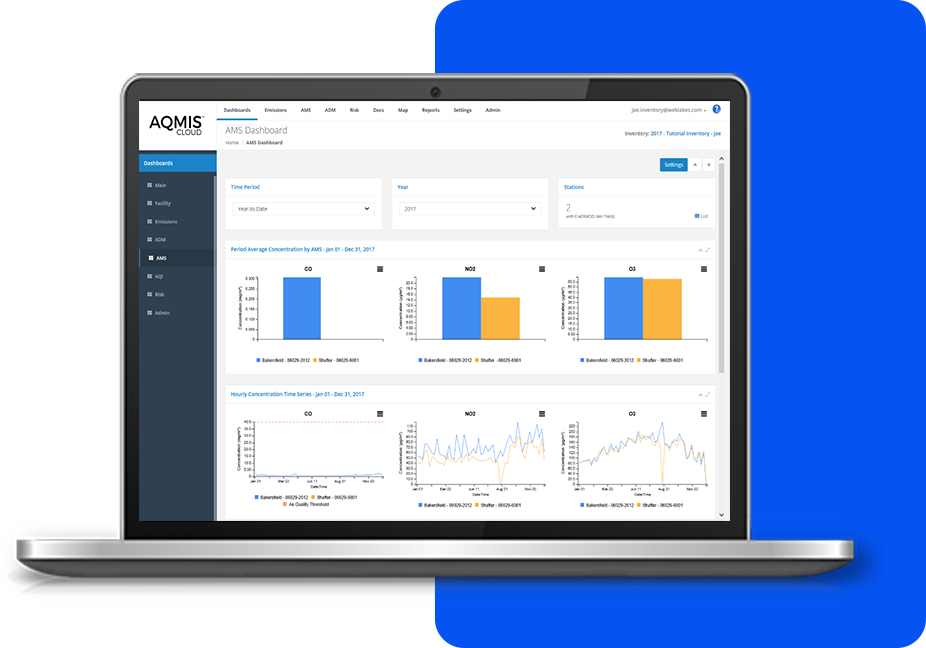
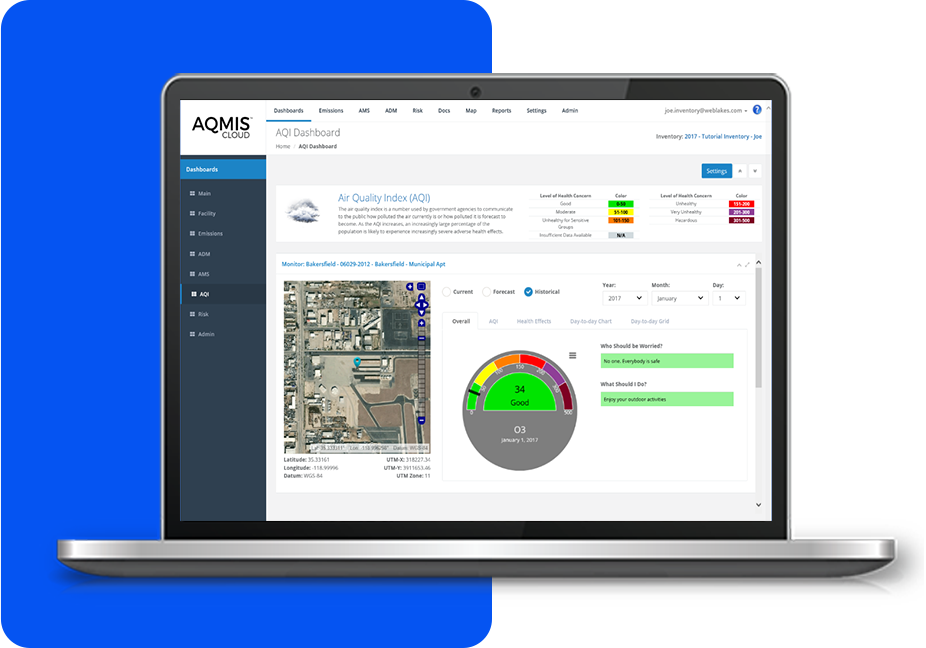
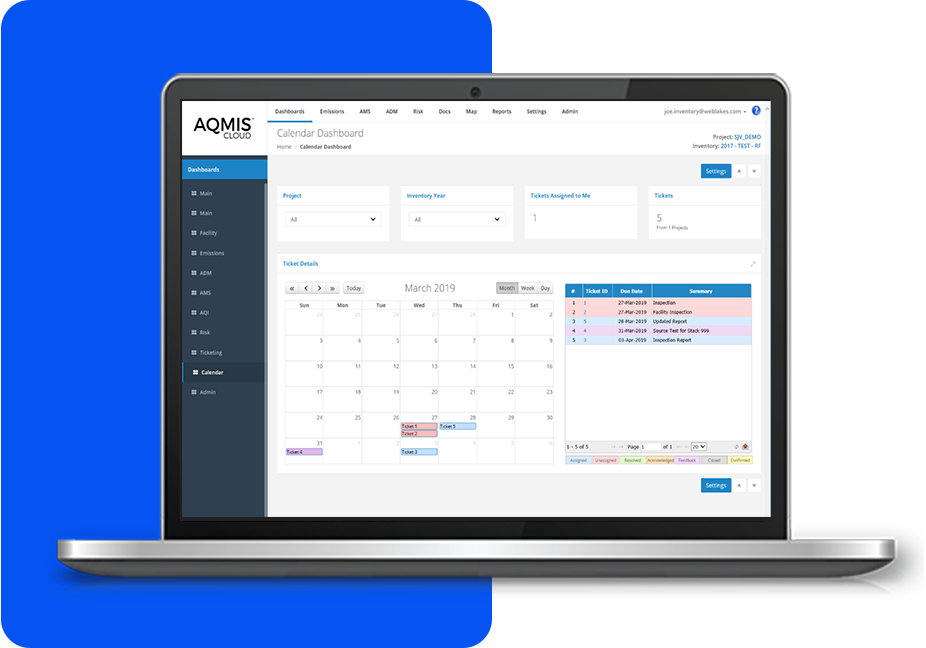
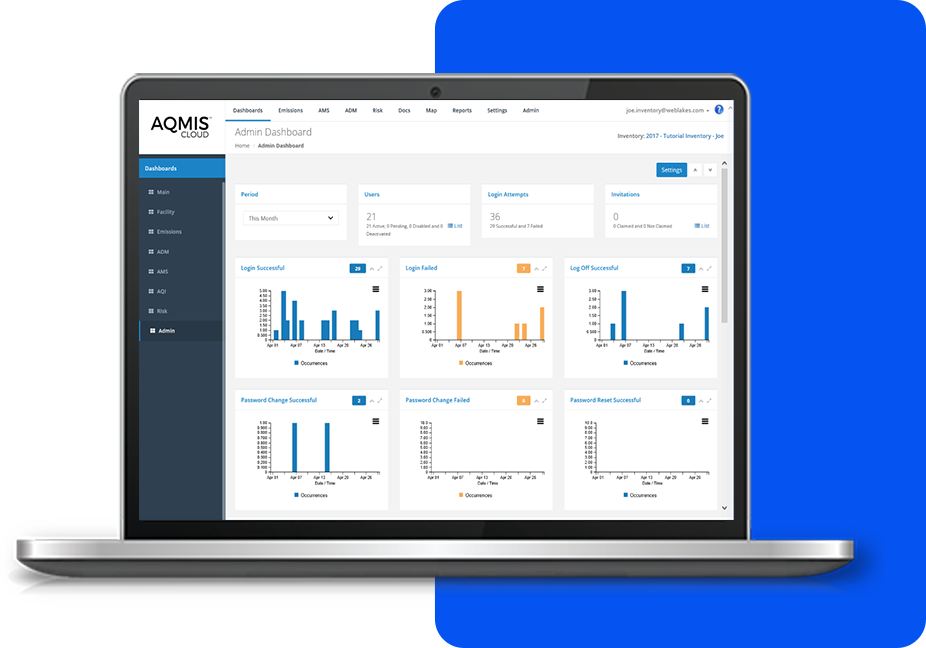
AQMIS offers dynamic dashboards that let you customize views and generate powerful analytics with ease. Gain actionable insights and make informed decisions with streamlined, data-driven visuals.

Main Dashboard
- Overview of active emission inventory years, facilities, and pollutants.
- Media-specific totals for air, water, wastewater, and solid waste.
- Interactive maps for facility locations and emissions by region or facility.
- Customizable graphs by pollutant or region.
Emissions Dashboard
- Aggregated emissions data across source types, pollutants, and regions.
- Temporal trends and multi-year analyses.
- Customizable views for role-specific focus and easy data export (PDF, Excel, CSV, etc.).


Facility Dashboard
- Comprehensive facility data at a glance: emissions controls, release points, classification codes, and more.
- Interactive maps for facility location and regulatory oversight.
Air Dispersion Modeling (ADM) Dashboard
- View pollutant-specific air concentration contours and gradients.
- Simulate multiple dispersion scenarios (e.g., historic, real-time, forecast).
- Identify emission sources affecting modeling domains.


Risk Dashboard
- Evaluate chronic and acute health risks by pollutant or exposure pathway.
- Cumulative risk visualization against regulatory benchmarks.
Ambient Monitoring Station (AMS) Dashboard
- Detect exceedances of regulatory thresholds or custom targets.
- Explore temporal and spatial pollutant trends with interactive charts.
- Automatically calculate and display Air Quality Index (AQI) metrics.


Air Quality Index (AQI) Dashboard
- Simplified AQI scores with real-time and forecasted data.
- Insights on pollutant-specific health risks and recommended actions.
- 24-hour AQI trend visualizations for public awareness.
Data Quality Dashboard
- Visual summaries of data completeness and validity.
- Classify data as Good, Bad, Critical, or Disconnected for rapid analysis.


Ticketing & Calendar Dashboards
- Track tasks and deadlines with color-coded statuses.
- Filter tickets by assignment or due date for streamlined project management.
Administrative Dashboard
- Monitor system usage and manage user access.
- Review login trends, password resets, and user activities with customizable graphs.

Why Choose AQMIS?
- Customizable: Tailor dashboards to your role and responsibilities.
- Insightful Visuals: Explore data trends with interactive maps, charts, and graphs
- Efficient Reporting: Export data in multiple formats for seamless communication
- Regulatory Compliance: Simplify monitoring and reporting to meet industry standards.
Experience the power of AQMIS to transform complex environmental data into actionable insights.
DEMO REQUEST
Want to see AQMIS in Action?
AQMS offers a range of tailored solutions designed to address and adapt to your specific environmental management needs. Click the button below to request a demo and discover how our platform can support your objectives.
