1-170 Columbia St. W

WRPLOT View Features

WRPLOT VIEW

Key Features

WRPLOT View provides a detailed user experience to users at no cost.

WRPLOT Main Feature

Wind Rose Visualization

You can quickly and easily visualize wind rose plots for your meteorological data. This method is an excellent way to summarize large volumes of wind data efficiently. It allows you to identify patterns and trends in wind behavior at a glance. Additionally, wind rose visualizations are useful for performing quality assurance on your data.

Analyze your Met Data

You can quickly analyze your meteorological data with tools like wind rose plots, frequency distribution tables, and wind class frequency distribution graphs. These tools help visualize wind patterns and frequencies in a clear and efficient manner. Wind rose plots show the direction and strength of wind, while frequency distribution tables break down the occurrence of different wind speeds.

WRPLOT Graph Feature
WRPLOT Excel Feature

Support for Multiple File Formats

WRPLOT View supports all of the most common file formats for data analysis. For formats that are not directly supported, an Import from Excel utility is available. This tool makes it easy to import data by converting it from Excel files. As a result, you can work with a wide range of file types without complications.

Wind Rose Visualization in Google Earth

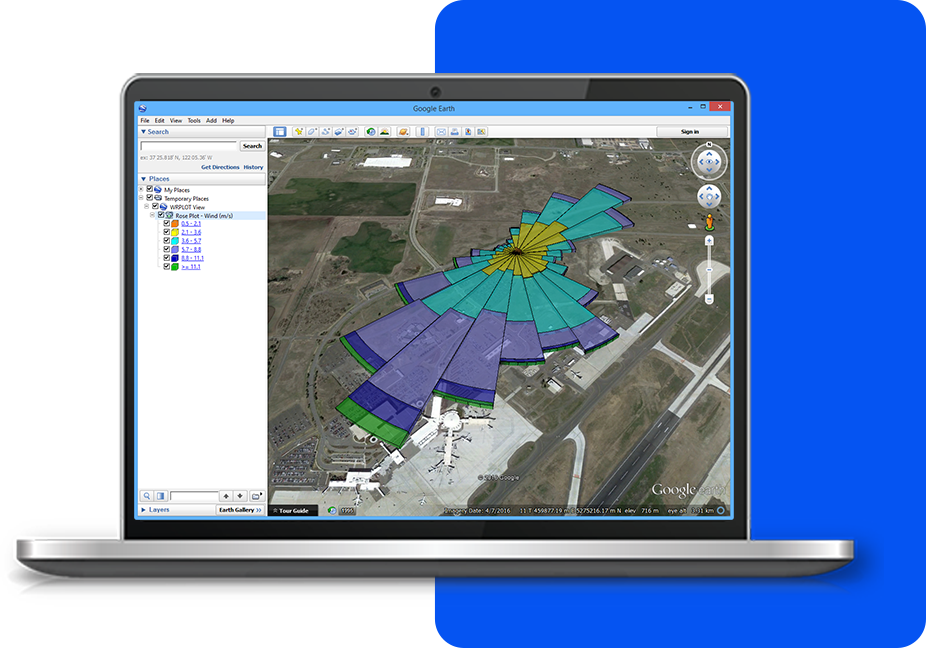
WRPLOT View makes it easy to export your wind rose plots directly to Google Earth. You have full control over the customization of your wind roses, including color choices, opacity, and maximum radius. This flexibility allows you to tailor the visual representation to your needs. By integrating with Google Earth, you can view your wind data in a geographic context for better analysis.

WRPLOT Google Earth Feature
MODELING TIPS

Latest Software Tips

Unlock the full potential of your environmental software with expert guidance. These tips will help you streamline processes, improve accuracy, and maximize efficiency in every project.