1-170 Columbia St. W

IRAP-h View Features

IRAP-H VIEW

Key Features

IRAP-h View contains many features designed to reduce completion of risk assessment projects from months to days. This means significant savings in time, resources, and costs.

IRAP-h View Main Feature

Integrated Graphical User Interface

IRAP-h View offers a user-friendly graphical interface with intuitive tools for conducting risk assessments. It simplifies the process of performing risk calculations and generating detailed reports. The graphical tools are designed for ease of use, enhancing efficiency throughout the project. Comprehensive output reports provide clear and thorough results, supporting informed decision-making.

Extensive COPC Database

Includes the complete US EPA database of Compounds of Potential Concern (COPCs). This database comes fully integrated with fate and transport parameters for each chemical. Users have direct access to this extensive information, enhancing the accuracy of risk assessments. The inclusion of these parameters streamlines the modeling process and supports comprehensive analysis.

IRAP-h View COPC Feature
IRAP-h View Contouring Feature

Complete Contouring Options

Allows you to plot both risk results and COPC concentrations, providing exceptional visualization of your data. These plots enable users to clearly interpret and analyze outcomes. By visualizing risk and concentration data side by side, users gain deeper insights into their assessments. This feature enhances the overall clarity and effectiveness of the risk analysis process.

Analyze Multiple Scenarios

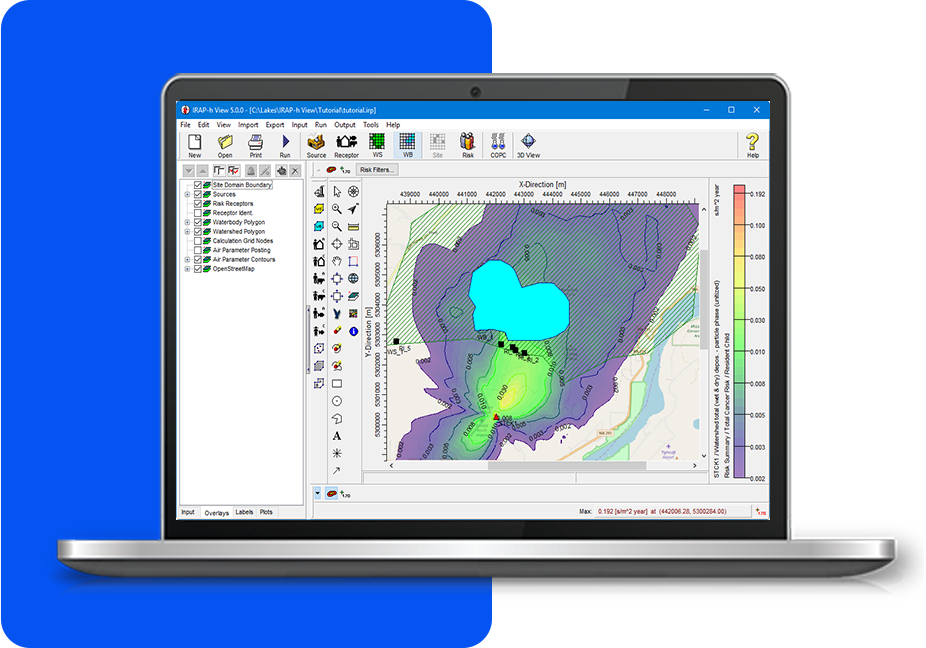
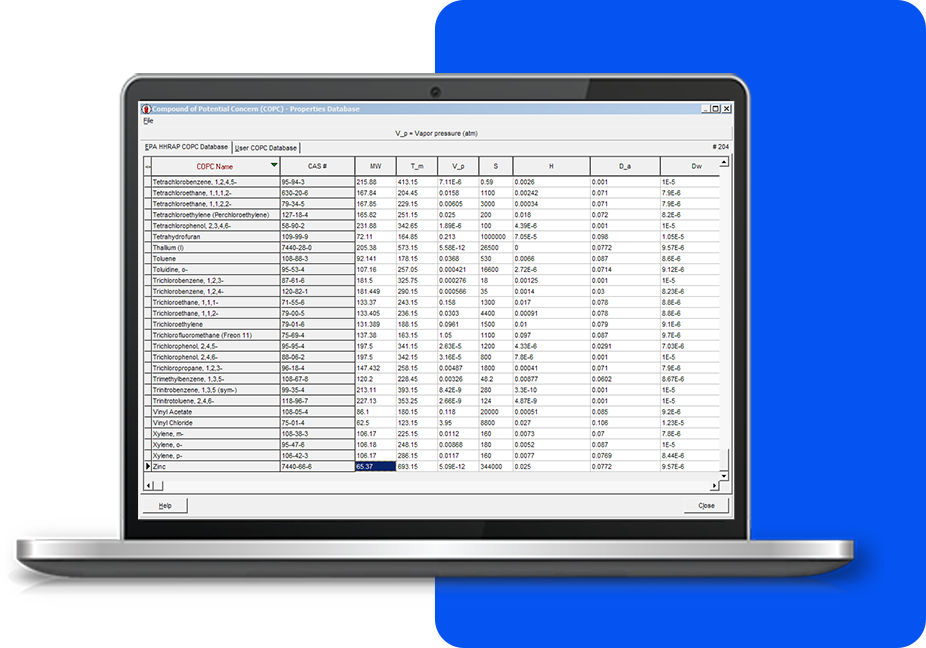
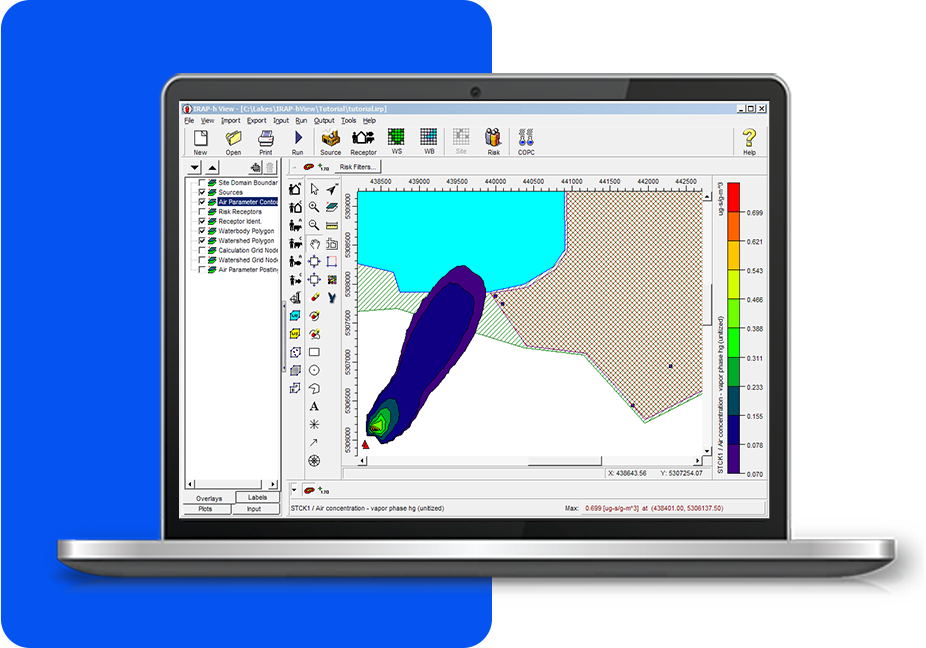
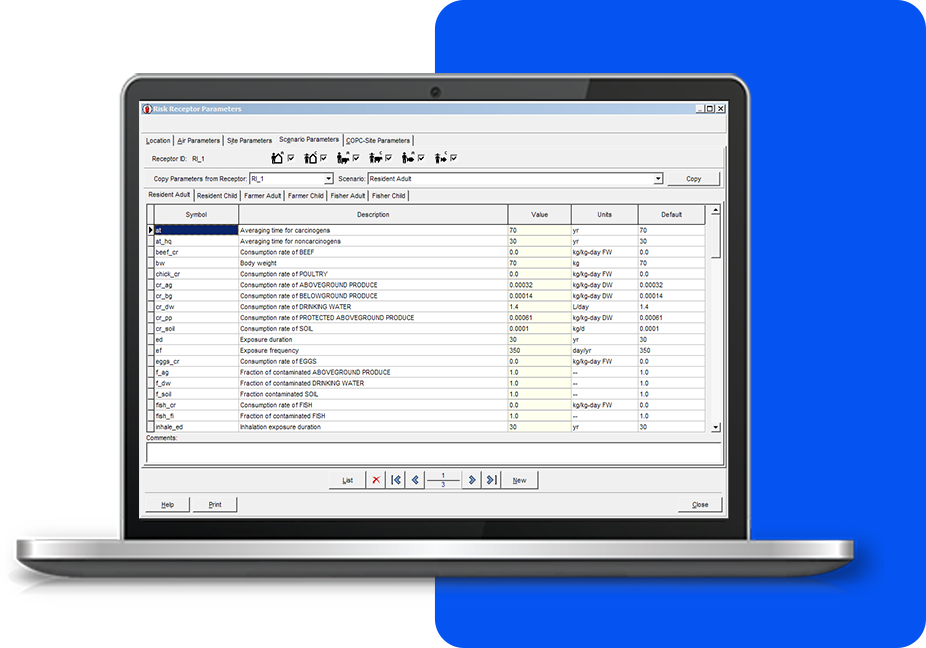
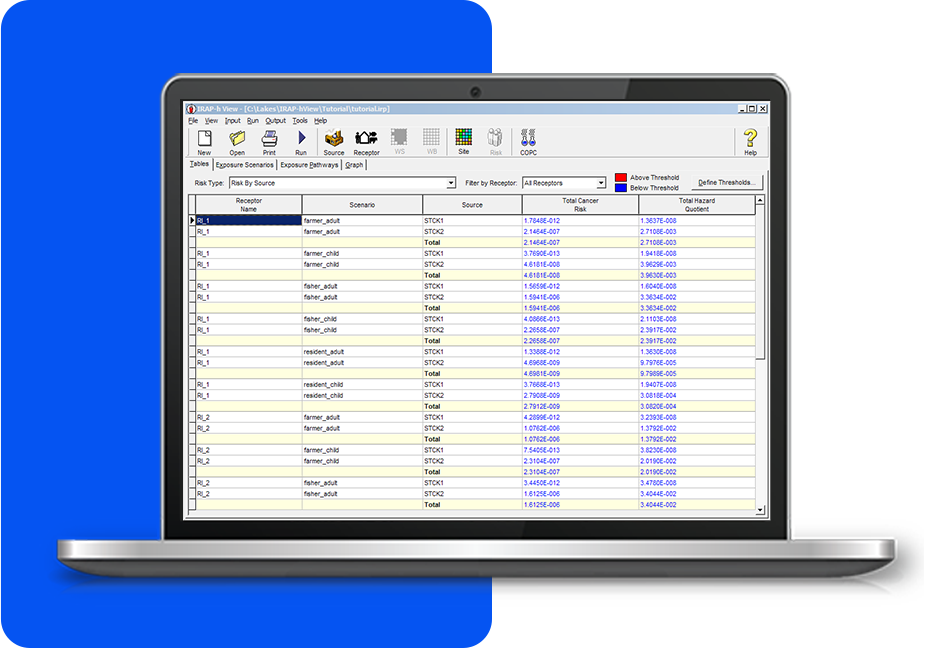
IRAP-h View enables the analysis of multiple risk receptors, chemicals, and scenario parameters within a single project. This feature allows users to evaluate complex situations more efficiently. By handling multiple variables simultaneously, the tool streamlines the risk assessment process. It provides comprehensive results that account for various factors in a single workflow.

IRAP-h View Scenario Feature
IRAP-h View Tables Feature

Comprehensive Risk Table Output

IRAP-h View generates a comprehensive set of tables that summarize risk and concentration values. These tables make it easy for users to quickly access and review their results. The clear organization of data enhances the efficiency of analyzing risk assessments. This feature ensures that all key information is readily available for informed decision-making.

MODELING TIPS

Latest Software Tips

Unlock the full potential of your environmental software with expert guidance. These tips will help you streamline processes, improve accuracy, and maximize efficiency in every project.