1-170 Columbia St. W

Percent View Features

PERCENT VIEW

Key Features

Percent View contains features that enhance post-processing of AERMOD & ISC air dispersion modeling results.

Percent Main Feature

Free and Easy to Use

Percent View processes AERMOD and ISC postfiles to generate series plots for each receptor location. These plots allow you to visualize data trends over time for specific receptors. This feature enhances data analysis by offering a clear graphical representation of air quality impacts.

Generates Percentile Graphs and Plotfiles

Generates PLOTFILEs for selected percentiles, such as the 99.8th or 95th. These files can be visualized using Lakes Environmental's AERMOD View or other graphics software like Surfer. This feature allows for detailed percentile-based data analysis and visualization.

Percent Graphs Feature
Percent Rolling Averages Feature

Calculates Rolling Averages

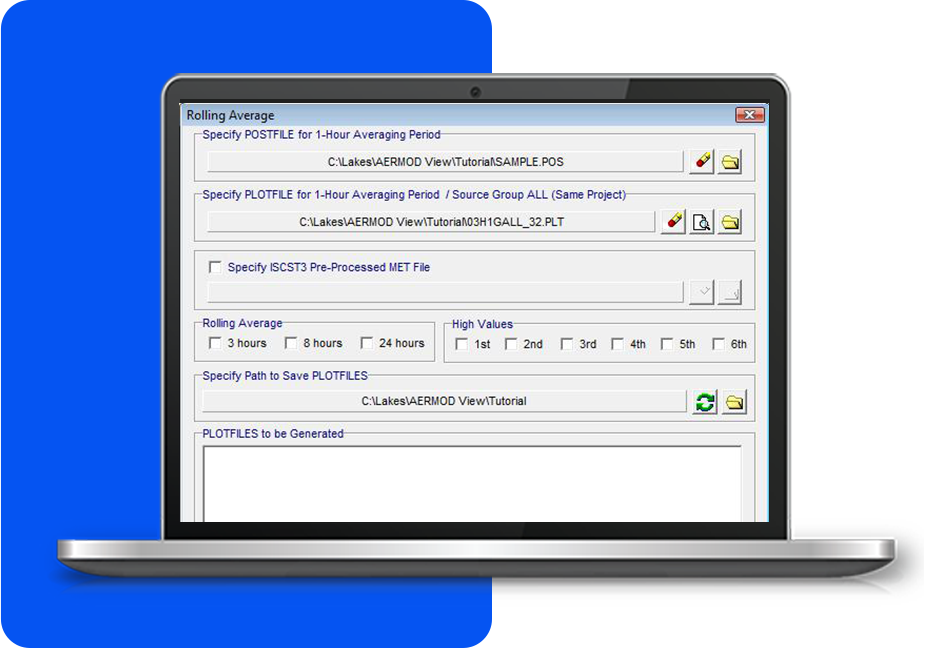
Percent View computes rolling averages over 3, 8, or 24-hour periods based on 1-hour average concentrations. This allows for more detailed analysis of air quality trends over time. By calculating these averages, users can better assess short- and long-term concentration levels.

MODELING TIPS

Latest Software Tips

Unlock the full potential of your environmental software with expert guidance. These tips will help you streamline processes, improve accuracy, and maximize efficiency in every project.