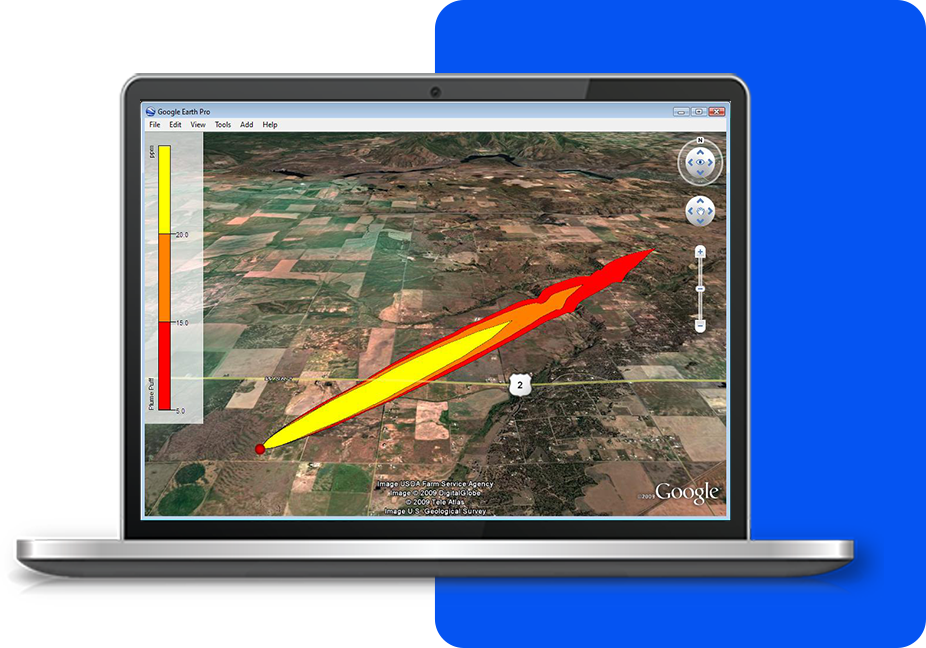
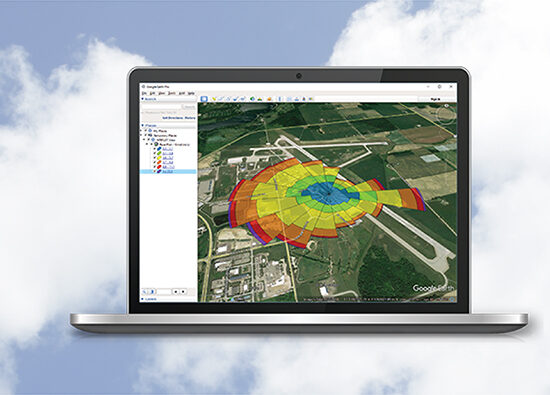
SLAB View™
SLAB View Main Features
![]() |
Integrated Graphical User InterfaceFully integrated interface combining easy to use graphical tools, seamless model run, and automated contouring and posting of results. |
![]() |
Multiple Release TypesSLAB View models several different release types:
|
|
3D VisualizationWatch the plume disperse in three dimensions using the 3D View option. Understanding how a release spreads has never been easier. SLAB 3D allows you to create animations of plume migration that can be incorporated into most presentation packages. |
![]() |
Export to Google Earth™This exciting feature allows you to export the footprint and or puff of the source spill into Google Earth giving you a more realistic image of where the spill will impact surrounding areas.
|
![]() |
Graphical and Output OptionsSLAB View provides you with full control of the appearance of your footprints and puffs. You can specify the footprint levels (ppm) to be displayed, which colors to use, line thickness, and much more. |
![]() |
Extensive Chemical DatabaseSLAB View has an extensive database of chemicals that can be modeled, including their properties. User defined chemicals can also be added. |
![]() |
Support for Several Base Map FormatsSLAB View has support for a variety of image and base map formats allowing you to setup your model with confidence and easy visualization and identification of the location of your spill area. Supported base maps include: Bitmap, DLG, DXF, JPEG, LULC, MrSID, Shapefile, and TIFF/GeoTIFF. |
![]() |
Maximum Concentration GraphsSLAB View automatically generates graphs displaying the Maximum Concentration Along the Centerline for all the meteorological conditions being modeled. You can specify the Level of Concern (LOC) for the chemical being modeled to be shown in the graph (indicated in this image as a red line). |
![]() |
SLAB Output ReportSLAB View produces several easy ways for you to understand the SLAB output results. You can view the footprint, the puff over time, graphs of maximum concentration alog centerline, and a text report sumarizing the input and output data. |
Additional Information
See Tech SpecsSee Resources


