AERMOD View contains a wealth of graphical tools and options so that users can customize the way model output is presented graphically. The application has a Contours Panel (also referred to as the Graphical Output Toolbar) along the bottom of the main display to aid users in quickly accessing these tools and identifying output data.
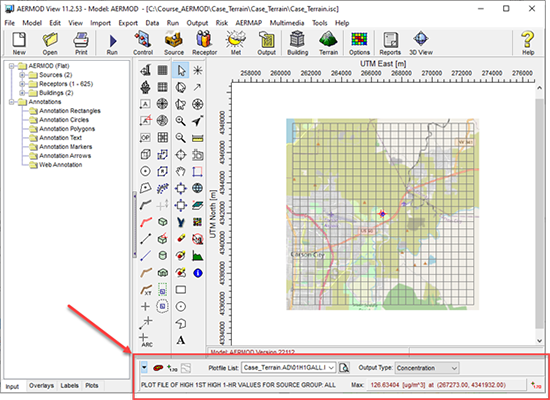
Location of the Contours Panel
The Contours Panel allows you to easily turn on and off contouring, post concentrations, and acts as a quick reference to the maximum result value of the selected contour plot. This toolbar also allows you to quickly select which contour plot file and output type should be displayed. As you select different output types, the drawing area is refreshed, and the results are displayed for the new option.
Options along the Contours Panel include the following:
- Collapse tool: Allows you to remove the details of the parameters displayed in the drawing area.
- Expand tool: Allows you to add the details of the parameters displayed in the drawing area.
- Show Contours tool: Provides the option of turning on or off the display of the contours.
- Show Concentrations tool: Allows the user to turn on or off the display of the result values at each receptor location.
- Show Plume Animation Contours: Enables you to turn on or off the display of contours in the plume animation mode.
- Show Terrain tool: If you have elevated terrain, this tool allows you to turn on or off the display of the terrain contours.
- Plotfile List: This drop-down list contains all the contour plot files generated for the current model run. Select from this list the contour plot file you wish to display.
- Preview tool: Provides the option to preview the contents of the selected plotfile in WordPad.
- Output tool: This drop-down list displays the output types available for the current AERMOD Plotfile. The available options depend upon what output options were selected for the model run (Dispersion Options screen in the Control Pathway). Select the desired output type from the drop-down list to display the selected output in the drawing area.
- Concentration: Select this option to show concentration results for the current plotfile.
- Deposition: Select this option to show deposition results for the current plotfile.
- Dry Deposition: Select this option to show dry deposition results for the current plotfile.
- Wet Deposition: Select this option to show wet deposition results for the current plotfile.
- Elevation: Select this option to show elevations for the current plotfile.
- Hill: Select this option to show hill profile for the current plotfile.
- Max: AERMOD View reads the selected contour plot file, which gives the calculated concentration and/or deposition values at each receptor location, and then displays in the Max panel the maximum concentration or deposition value along with the X and Y coordinates for the position of receptor where this maximum value occurs.

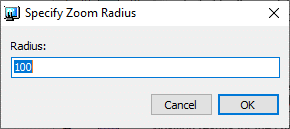
Zoom to Maximum Concentraiton: Allows the modeler to define a radius at which the display will zoom in and display the location of the maximum concentration and/or deposition value of the selected contour plot file.