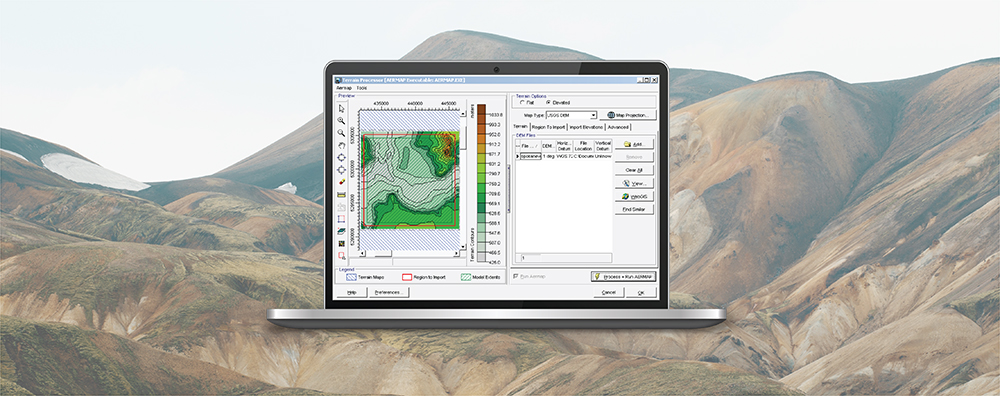
Contour plots are one of the most common forms of output from air dispersion models. They are useful in quickly identifying maximum concentration as well as trends in the data, but they also require a careful eye to ensure proper interpretation.
One example is the PLOTFILE output generated by the AERMOD air dispersion model. In Lakes Environmental’s AERMOD View, users enable this output type via the Contour Plot Files settings in the Output Pathway.These files report user-defined high values (ranging from 1-999) at each modeled receptor. For short-term averaging periods (e.g., 1-hour, 24-hour, etc.), these high values are time-independent meaning each reported value can occur at different times.
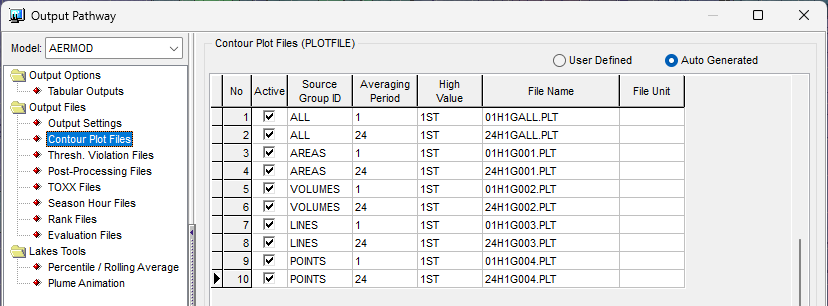
Contour Plot Files Settings in AERMOD View.
Knowing the date and time of a maximum concentration occurrence is very important in data analysis and interpretation. The Contour Plot Files contain this information, and AERMOD View includes a utility called the Plot File Grid View which makes this information easy to find and read. See steps below for how to access the Plot File Grid View.
Step 1: After a successful model run, navigate to the Plots tree menu.
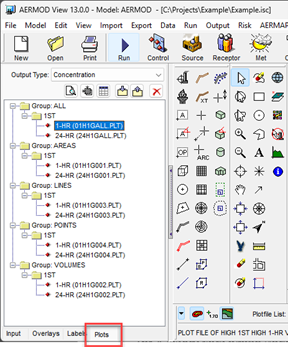
Step 2: Select the plot file of interest. Plot files are sorted by source group, high value, and averaging period.
In the example above, the selected plot file represents the 1st high for the 1-hour average of all sources combined (source group ALL).
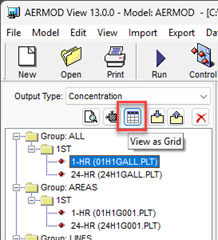
Step 3: Select the View As Grid button from the tree menu to open the Plot File Grid View.
Step 4: Scroll to the right to locate the Date column. You can now verify the date and time at which the concentration was modeled.
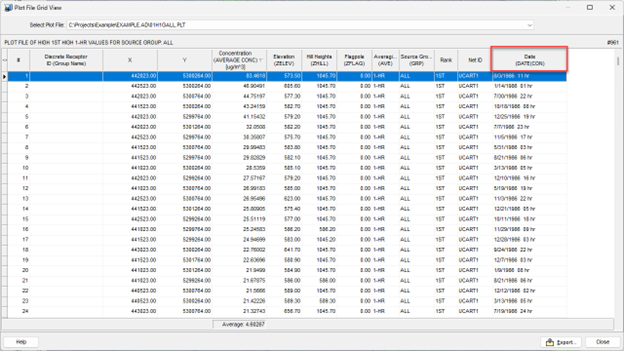
Other features of the Plot File Grid View include:
- The ability to sort data by each column. Simply click the column header to sort in ascending or descending order.
- Automated averaging of the concentration and deposition values found in the file.
- Export functionality to export the data to CSV format for easier post-processing and analysis.