When conducting an air dispersion modeling analysis, modelers may want to know not just what the value of the maximum concentration is but also how frequently concentrations exceed some upper limit or threshold. The U.S. EPA AERMOD air dispersion model comes with an option to extract these exceedances: the Threshold Violation File or MAXIFILE. Lakes Software’s AERMOD View application goes a step further and automatically counts those exceedances so that modelers can easily determine the frequency of such violations.
Like all output selections, the Threshold Violation File is defined in AERMOD’s Output Pathway. Thresholds can be set for each combination of modeled averaging periods and source group IDs. In the example below, the modeler is interested in finding concentrations that exceed 10 micrograms per cubic meter for the 1-hour averaging period in the ALL source group (the combined concentrations of all modeled sources).
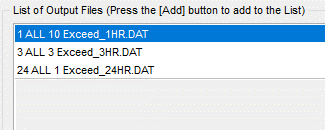
Unique file names should be used for each threshold of interest. For example, the run below would generate separate threshold files for the 1-hour, 3-hour, and 24-hour averaging periods for the same source group (ALL):
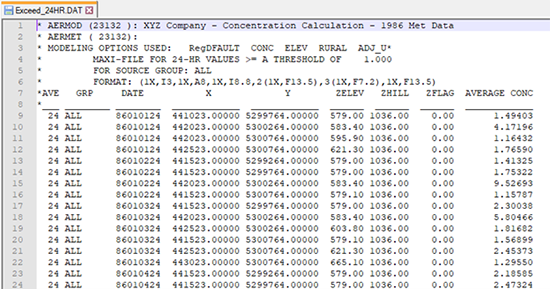
After successfully running the model, the Threshold Violation Files will be found in the project’s .AD sub-folder. The files can be opened in a text editor, and they contain a running list of the dates, times, locations, and concentrations that exceed the defined threshold. The 24-hour MAXIFILE produced in our example case is shown below.
When using AERMOD View to generate these output files, the application will use this file to produce a separate contour plot file with exceedance counts. These plots will be listed on the Plots Tree View under the Exceedance heading.
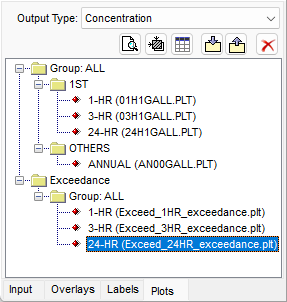
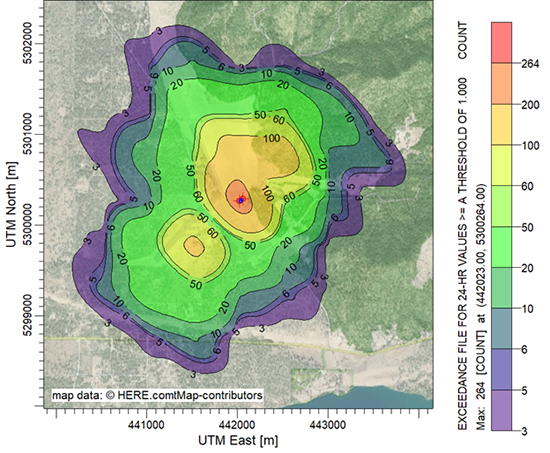
Select the desired exceedance plot for a view of exceedance frequency in the modeling domain. The example below shows a maximum of 264 exceedances for a daily (24-hour) average threshold of 1 ug/m**3.
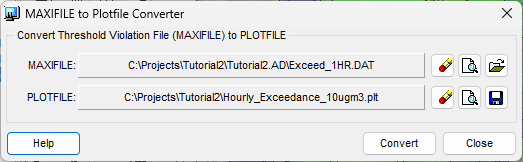
While the exceedance plot file generator is run automatically through AERMOD View, it can also be run independently to process existing Threshold Violation Files produced externally. This is done via the Tools | MAXIFILE Converter utility.
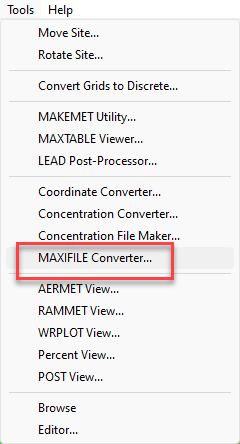
Simply point to the location of the existing Threshold Violation File, specify a name for the contour plot file, and click Convert.