For a very long time, using AERMOD to calculate the maximum annual average over a multi-year period required multiple model runs with each year being processed separately. That changed with a U.S. EPA update which allowed the model to produce individual year annual average results via the Post-Processing Output File (POSTFILE).
It is important to note that the main AERMOD output file (*.ADO with AERMOD View) still contains the multi-year annual average results. Lakes Software has made it easy to locate the separate averages in AERMOD View, though.
To enable the option to see individual year annual averages in AERMOD View, follow the steps below:
Step 1. Open the Control Pathway window
Step 2. Select the Pollutant/Averaging options
Step 3. Enable the Annual averaging period
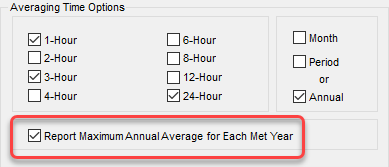
Step 4. Enable the Report Maximum Annual Average for Each Met Year option AERMET executable is the 22112 release, users can then enable (check) or disable (uncheck) each individual action.
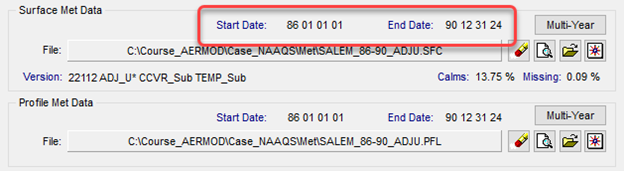
Step 5. Go to the Meteorology Pathway window
Step 6. Add your multi-year surface (*.SFC) and profile (*.PFL) files
Step 7. Finish setting up your project and run the model
The Report Maximum Annual Average for Each Met Year option automatically generates an annual average Post-Processing file for your model run.
* Maximum Annual Average POST file for Each Met Year
POSTFILE ANNUAL ALL PLOT TEST-RUN.AD\ANNUAL_GALL.PLT 31
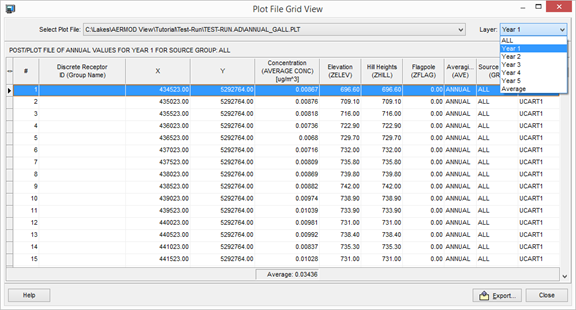
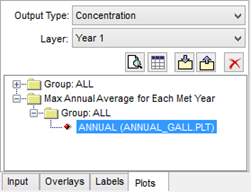
Upon successful model completion, the file will be displayed in the Plots Tree View under the Max Annual Average for Each Met Year heading. Use the Layer drop-down menu to choose which year you want contoured in the main display.
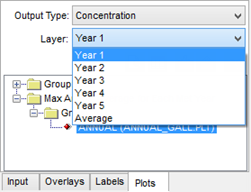
The file can also be opened in the Plot File Grid View to view the data in table format. The same Layer control allows the user to select which year is displayed.