A standard model run using the AERMOD air dispersion model produces numeric output with up to 13 significant figures (e.g., xxxxxxxx.xxxxx). Projects which use very low or very high emission rates may run into a problem where the values output by the model do not fit properly within this limit. For example, concentration values of 1E9 units or higher will result in a field of asterisks written to the output file as shown below.
ALL HIGH 1ST HIGH VALUE IS************** ON YYMMDDHH: AT ( XXXXXX.00, YYYYYYY.00, ZZZ.00, HHHH.00, 0.00) GC UCART1
Concentrations which are below or very near to the default reporting threshold (1E-5) will result in repeating values of 0.00000 or 0.00001. With so many repeating values, AERMOD View becomes unable to properly generate contours due to the lack of precision.
The AERMOD model features two ways to handle this issue.
Edit the model’s unit labels. In the Source Pathway, go to the Emission Output Unit settings. The default settings use GRAMS/SECOND as the emission label and MICROGRAMS/M**3 as the concentration unit with a unit factor of 1E6. By selecting the User Defined option, the modeler can edit the unit factor and labels as needed.
For example, a unit factor of 1 and a concentration label of GRAMS/M**3 will print numeric values for very high results. Alternatively, a unit factor of 1E12 and a concentration label of PICOGRAMS/M**3 will display very low results.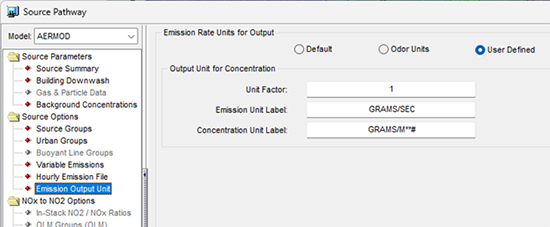
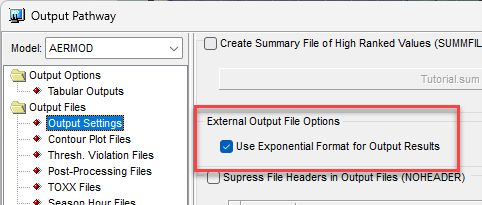
Write the data in exponential format. In the Output Pathway under Output Settings, enable the option to “Use Exponential Format for Output Results”. This will report all values in the external output files (e.g., Contour Plot Files, PLOT-formatted Post-Processing Files, etc.) using scientific notation so that the numeric values are fully written.