
When conducting an air quality modeling analysis, you may be called on to compute concentrations at sensitive receptors. While specific definitions of sensitive receptors vary from one jurisdiction to the next, it most commonly refers to receptors used in a modeling analysis to represent a sensitive population. Examples include schools, daycare facilities, hospitals, care facilities, and more.
The latest update to CALPUFF View (Version 8.6) includes the ability to flag discrete receptors as ‘sensitive’ and have their results compiled into a Sensitive Receptor Summary Report.
Follow the steps below to use the sensitive receptor function:
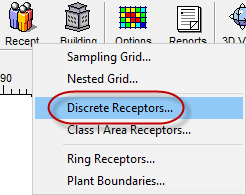
- Go to the Receptor button on the Toolbar and select Discrete Receptors
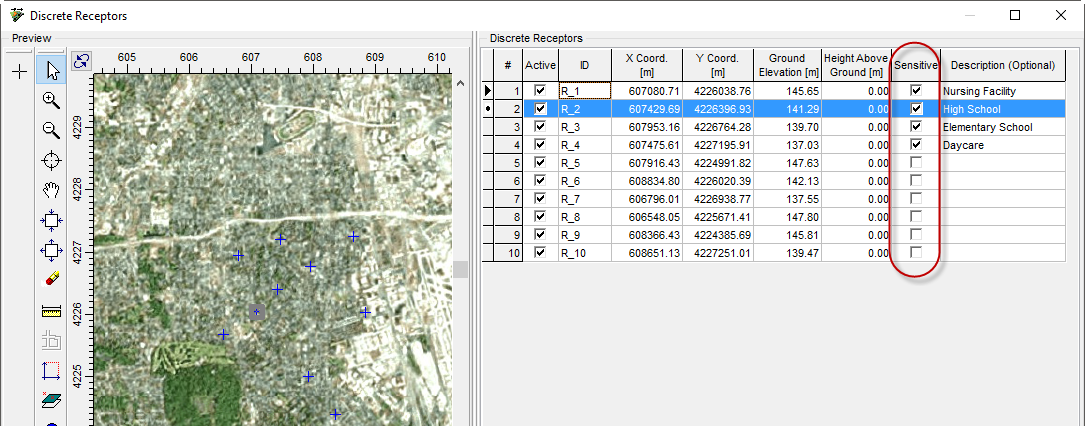
2. Use the table and Preview panel to place or identify discrete receptors of interest. Place a checkmark in the Sensitive column to flag the receptor for inclusion in the report. Consider adding a Description to add detail to the selected receptors as that information is carried over to the Sensitive Receptor Summary Report
3. Complete your CALPUFF modeling analysis as usual.
5. Run CALPOST to complete processing.
6. Select the Reports Toolbar button.
7. Select the Sensitive Receptors summary report. The Advanced Filter allows you to sort which Pollutants are displayed in the report.
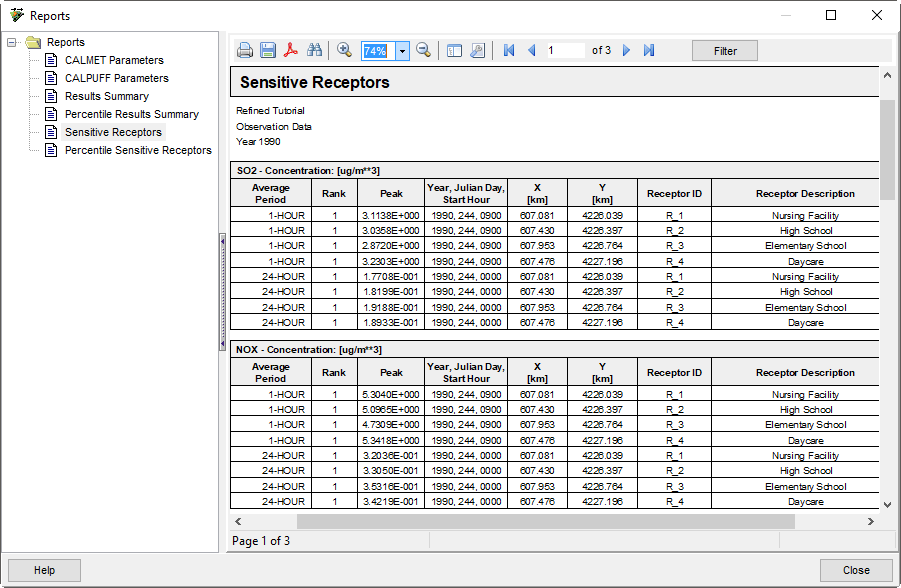
Results in the report are sorted by pollutant, averaging period, and rank. Receptor coordinates, ID, and description are also included. A separate Percentile Sensitive Receptors report is available to summarize percentile results.