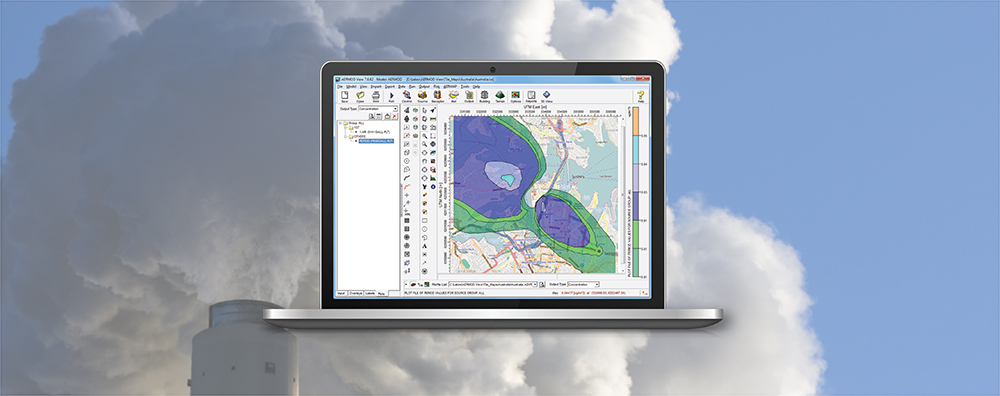
AERMOD View: When Numerical Values Are Outside AERMOD’s Default Threshold
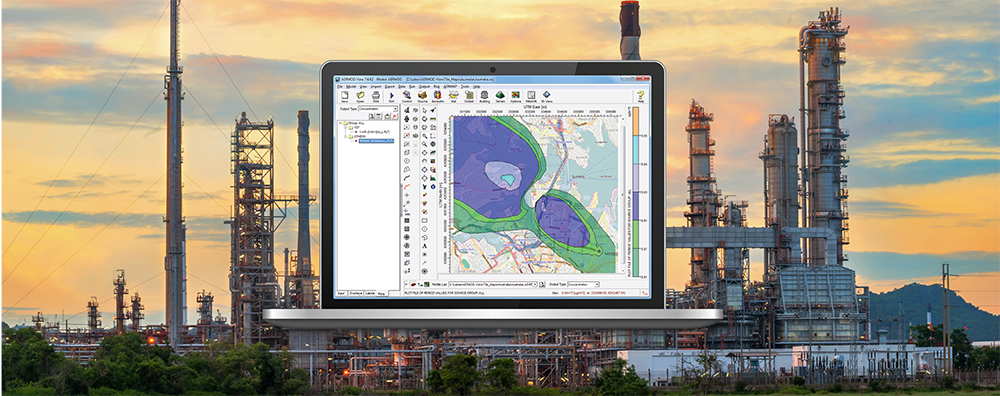
A standard model run using the AERMOD air dispersion model produces numeric output with up to 13 significant figures (e.g., xxxxxxxx.xxxxx). Projects which use very low or very high emission rates may run into a problem where the values output by the model do not fit properly within this limit. For example, concentration values of 1E9 units or higher will result in a field of asterisks written to the output file as shown below.