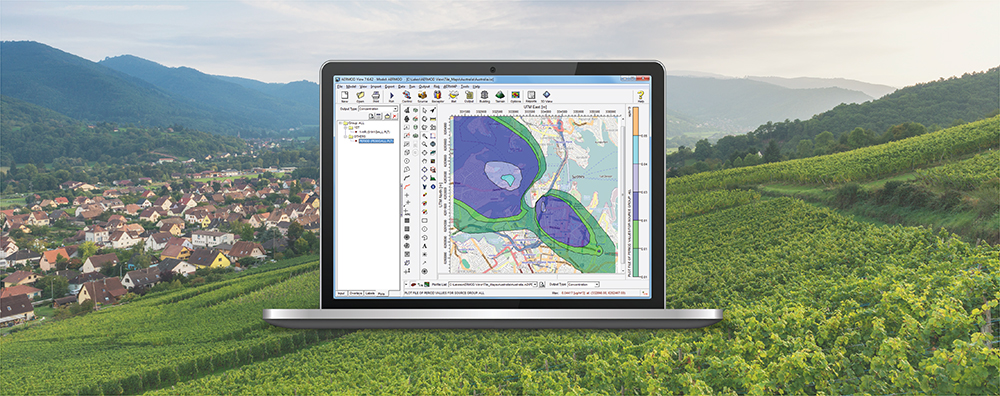
1-170 Columbia St. W

Air Dispersion Modeling

  • September 21, 2023

CALPUFF View: New Top 50 Table Viewer

Last month’s tip discussed the new Top-50 Table Viewer, one of the new additions to CALPUFF View Version 10.0 which aids modelers in visualizing output from the CALPOST postprocessor. Another addition to this release of CALPUFF View is the Ranked Values Grid View.

  • August 17, 2023

AERMOD View: Access Graphical Output Options via Contours Panel

When conducting an air dispersion modeling analysis, modelers may want to know not just what the value of the maximum concentration is but also how frequently concentrations exceed some upper limit or threshold. The U.S. EPA AERMOD air dispersion model comes with an option to extract these exceedances: the Threshold Violation File or MAXIFILE. Lakes Software’s AERMOD View application goes a step further and automatically counts those exceedances so that modelers can easily determine the frequency of such violations.

  • July 19, 2023

AERMOD View: Batcher Utility

When conducting an air dispersion modeling analysis, modelers may want to know not just what the value of the maximum concentration is but also how frequently concentrations exceed some upper limit or threshold. The U.S. EPA AERMOD air dispersion model comes with an option to extract these exceedances: the Threshold Violation File or MAXIFILE. Lakes Software’s AERMOD View application goes a step further and automatically counts those exceedances so that modelers can easily determine the frequency of such violations.

  • June 21, 2023

CALRoads View: Hourly Concentration Output in CAL3QHCR

CALRoads View includes three mobile source air dispersion models: CALINE4, CAL3QHC, and CAL3QHCR. These models are used for predicting air pollution concentrations of carbon monoxide (CO), nitrogen dioxide (NO2), particulate matter (PM), and other inert gases from idle or moving vehicles.

  • May 18, 2023

CALRoads View: Import Group Links

CALRoads View makes it very easy to input links to a modeling project using one of the CALINE series of models (CALINE, CAL3QHC, CAL3QHCR). While it’s common to graphically depict links, CALRoads also allows modelers to import links using an Excel spreadsheet template. This is useful for modelers who have all of their inputs defined or those who have a lot of data to input. The template spreadsheet is found in the C:\Lakes\CALRoads View\Templates folder.

  • April 19, 2023

WRPLOT View: Comparing Wind Roses

Wind roses are used to graphically depict wind frequency. Directly comparing wind roses from two different sets of meteorological data is a great way to compare how similar the data is. This is commonly done when comparing observational data to that generated with a meteorological model such as WRF or MM5.