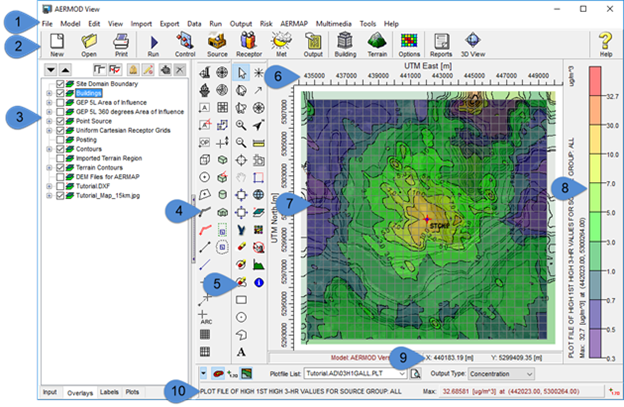
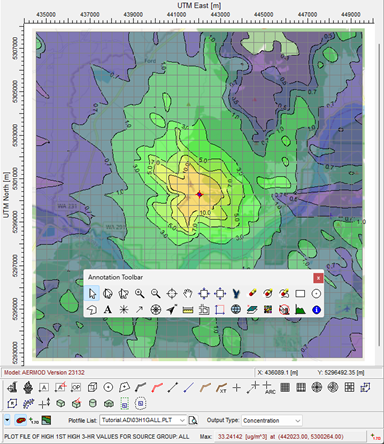
Lakes Software’s commercial applications all feature a similar look and feel. This familiarity allows users to easily execute a variety of air dispersion models even when accessing a brand-new product for the first time. The image below uses AERMOD View to demonstrate the key components of each Lakes Software application.
These components include:
- Main menu bar listing all available commands
- Toolbar buttons for quick selection of primary menu commands
- Tree View with tabs for accessing different display options like Overlays and model output Plots
- Application toolbar for graphical definition of model objects
- Annotation toolbar for managing the contents of the drawing area
- Axis labels displaying the real coordinates of the modeling area
- Drawing area where all of the model input data is graphically displayed
- Color ramp displaying the contour levels of selected model output plots
- Coordinates panel showing the precise location of the mouse cursor in the project’s coordinate system
- Graphical output toolbar providing easy access to graphical output options and model output data
Each application has several customization options that allow users to create a display that suits their individual needs. Below is a list of useful features and available options to aid in this customization.
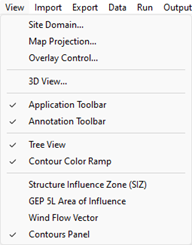
The View menu provides direct access to select which toolbars and panels are visible.
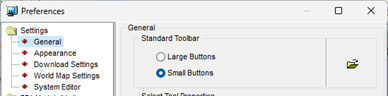
The size of the Toolbar buttons can be customized via the File | Preferences | General settings.
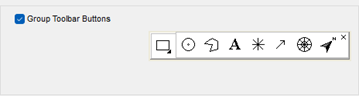
On the same General settings, users can choose to Group Toolbar Buttons together reducing the size of toolbars.
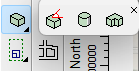
Each toolbar – Application, Annotation, & Graphical Output – can be easily moved by clicking and dragging the toolbar to another location. These can also be moved to be a floating toolbar dialog instead of fixed to the main display.
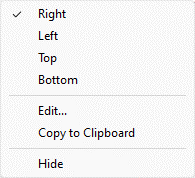
The Color Ramp can be moved by right clicking the panel and selecting the display location from the context menu.