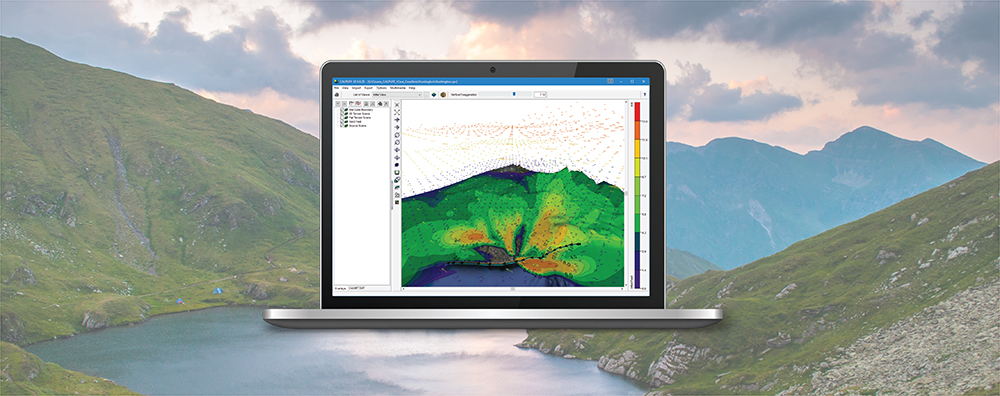
1-170 Columbia St. W

Modeling Tips

  • May 15, 2021

AERMOD View: Dispersion Options

The AERMOD modeling system has a variety of settings and options which can be employed in many ways. This includes options which have been pre-approved for use in regulatory applications and those which are meant for testing or may require additional approval in a regulatory context.

  • April 15, 2021

AERMOD View: Onsite Data in AERMET – Part 2: Data File Conventions

Last month, our tip described how AERMET reads custom meteorological data via its Onsite Pathway. AERMET’s Onsite Pathway gives users full control over how the model will read the data provided by the modeler, but there are some general conventions that must still be followed.

  • March 15, 2021

AERMOD View: Onsite Data in AERMET – Part 1: Formatting

AERMET – the meteorological pre-processor for the AERMOD modeling system – allows users to input their own custom meteorological data via its Onsite Pathway. This produces a highly representative dataset when using observations recorded at the site that will be modeled in AERMOD.

  • February 15, 2021

AERMOD View: Importing Gas & Particle Data

In addition to calculating air concentrations of pollutants, the AERMOD air dispersion model can calculate deposition fluxes from both particulate and gaseous emissions. When these routines are enabled, deposition parameters must be input to the model.

  • January 15, 2021

AERMOD View: Setting Stack Orientation

Air dispersion models typically have a variety of source types that can be used to represent sources of emissions. One of the most common source types is the point or stack release. Characterized by a well-defined exhaust point with buoyancy (via a defined exit temperature) and vertical momentum (calculated using the diameter of the release point and exit velocity), the point source is probably the most common source type employed in air dispersion modeling.

  • December 12, 2020

AERMOD View: Working with Labels

When working with Lakes Environmental Software applications, the drawing area affords users a lot of flexibility in how they add and visualize their project components. One way for users to make sense of the objects is to include object labels. These are controlled via the Labels tab on the Tree View.