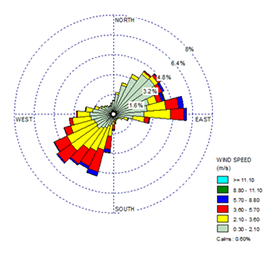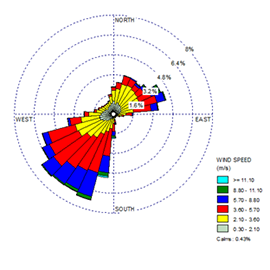
Wind roses are used to graphically depict wind frequency. Directly comparing wind roses from two different sets of meteorological data is a great way to compare how similar the data is. This is commonly done when comparing observational data to that generated with a meteorological model such as WRF or MM5.
Lakes Software’s WRPLOT View freeware application has long been a favorite tool of scientists in many different fields looking to analyze wind data. When using WRPLOT View to compare wind roses from different data sets, it is important to understand what is being depicted so an accurate assessment of the data can be made.
When a met data file is loaded into WRPLOT View, the wind rose that is generated is displayed on a scale that shows the percentage of time that the wind blows in each direction. By default, this scale is automatically determined to best fit the data.
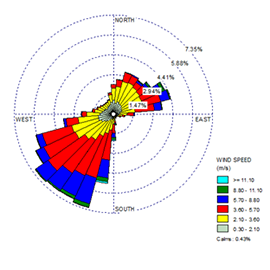
When two different wind roses are created, they may have different scales assigned to them by default. In the images below, notice that the first site has a maximum frequency just under 6% while the second site is near 7.35% for its maximum frequency.
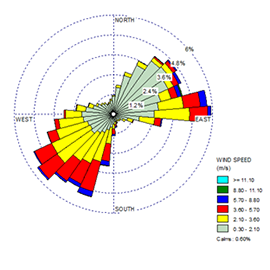
To make an accurate comparison, it is helpful to set the scales to be identical. To change the scale of a wind rose in WRPLOT View, do the following:
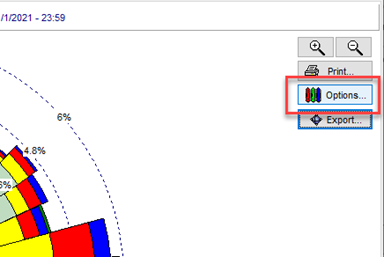
Step 1: Click the Options button on the Wind Rose tab.
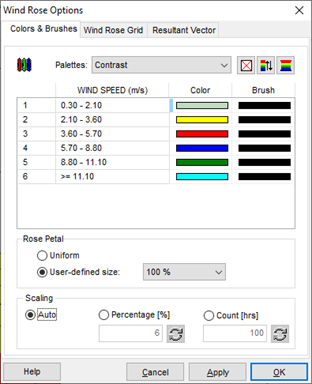
Select Percentage under the Scaling option.
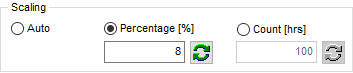
Step 3: Specify the desired scale.
Once the scales are the same for both wind roses, a visual comparison is much easier to perform.