
CALPUFF View: Calculating Percentiles
We previously discussed a fundamental limitation of the CALPUFF modeling system which places finite limits on how many objects and calculations the various system executables can handle in a single project.
Last month’s tip discussed the new Top-50 Table Viewer, one of the new additions to CALPUFF View Version 10.0 which aids modelers in visualizing output from the CALPOST postprocessor. Another addition to this release of CALPUFF View is the Ranked Values Grid View.
Most air dispersion models use simple text files for reading inputs and writing output data. To display these files, Lakes Environmental’s applications use the system’s default text editor. Users may prefer to use a different text editor to utilize different functionality or format data differently. To take advantage of these additional features, you can change the default text editor called by our software.
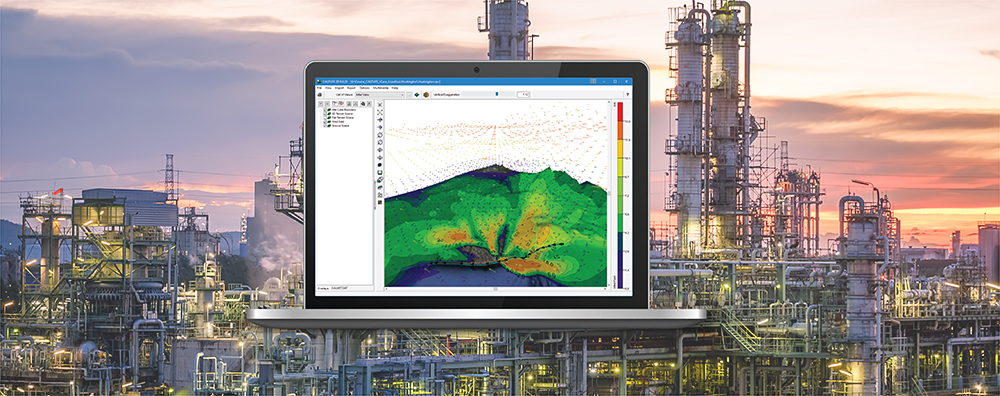
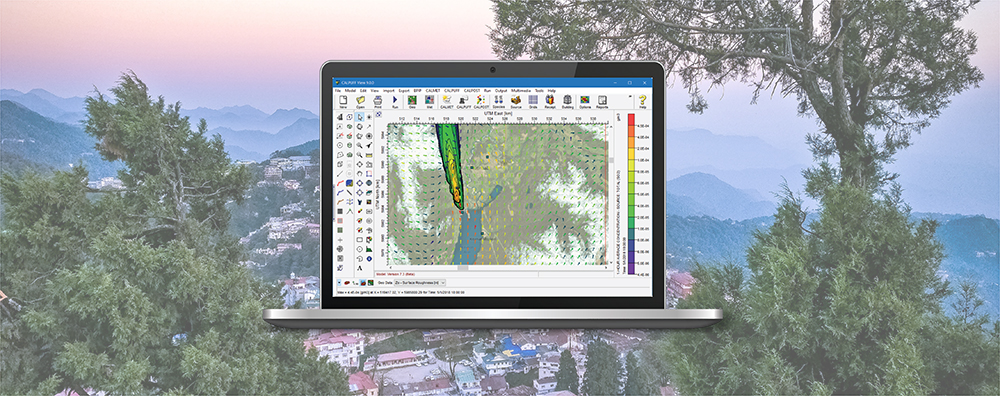
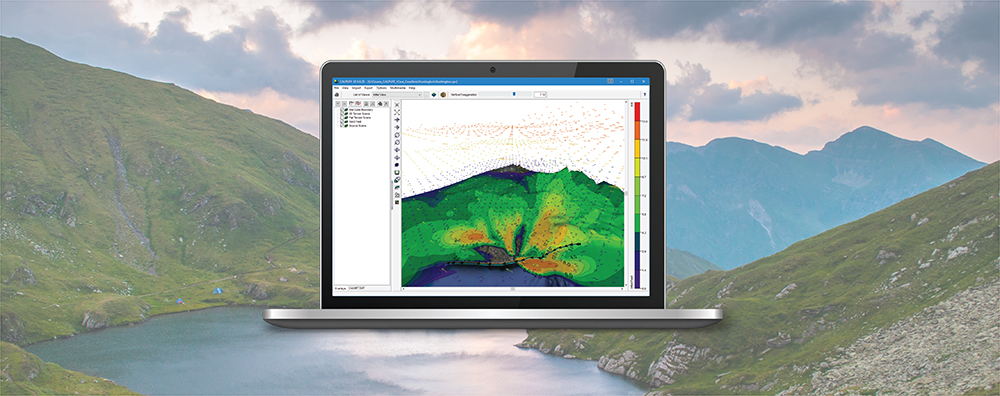
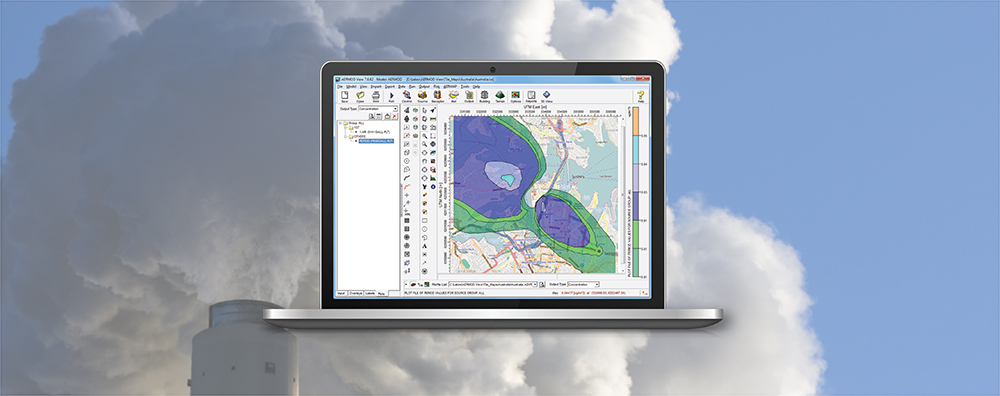
When conducting an air dispersion modeling analysis, the ability to present high-quality graphical depictions of the output is extremely important. Such images provide context to modeled results, and they provide a valuable tool to modelers in understanding and explaining the model’s calculations.
The CALPUFF modeling system is very sophisticated and supports a wide range of modeling scenarios. One limitation of the system is that there are finite numbers of objects that can be specified on the model input parameters.